Zip Codes with the Lowest Percentage of Births to Unmarried Women over the Age of 35 in Hyattsville, MD
RELATED REPORTS & OPTIONS
Lowest Illegitimacy | Women 35+
Hyattsville
Compare Zip Codes
Map of Zip Codes with the Lowest Percentage of Births to Unmarried Women over the Age of 35 in Hyattsville
49.5%
5.0%
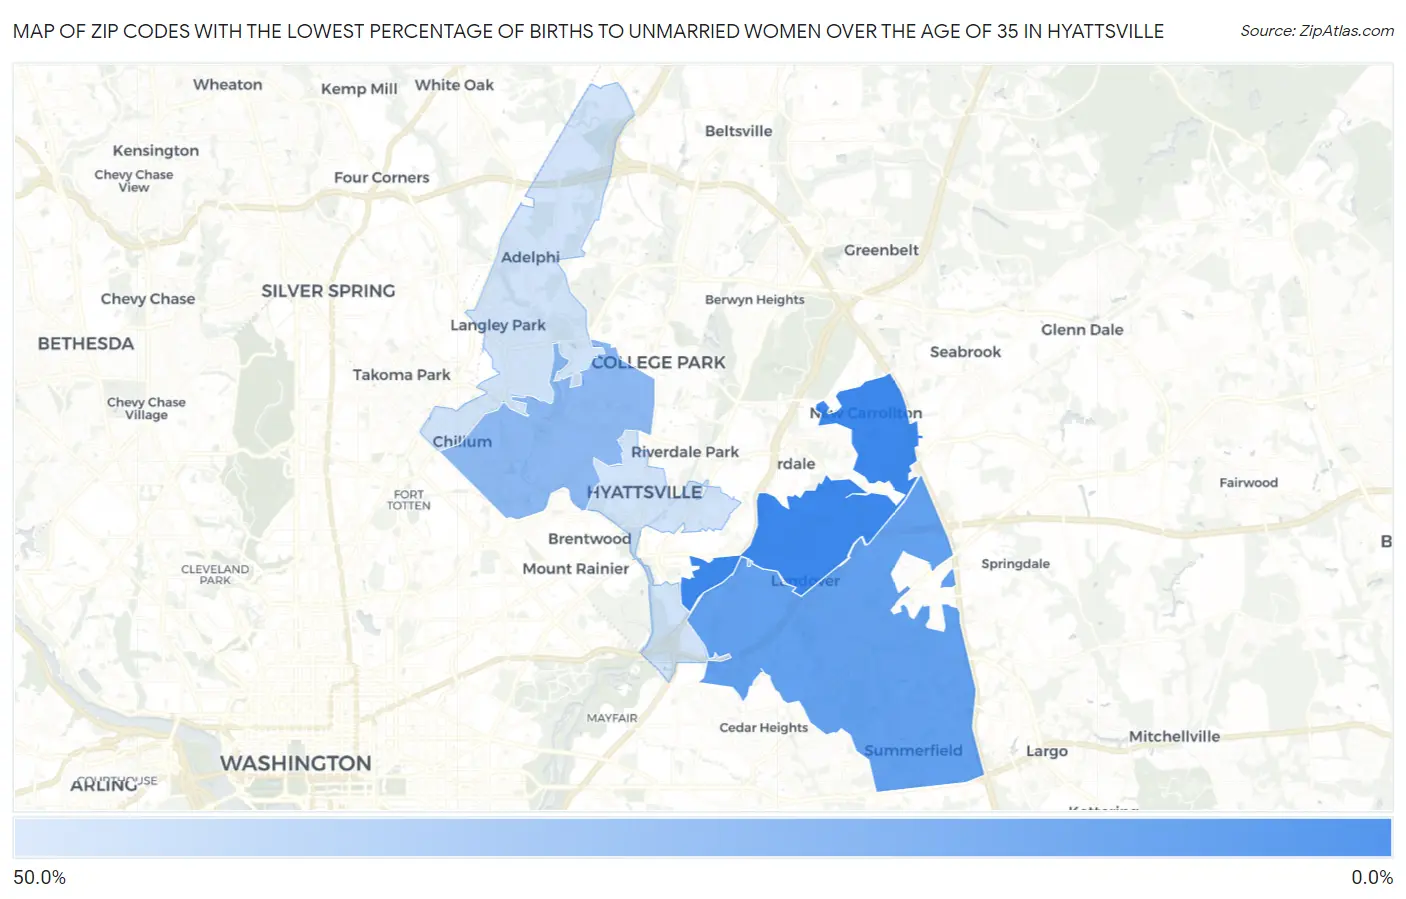
Zip Codes with the Lowest Percentage of Births to Unmarried Women over the Age of 35 in Hyattsville, MD
| Zip Code | % Unmarried | vs State | vs National | |
| 1. | 20784 | 5.0% | 19.5%(-14.5)#4 | 20.1%(-15.1)#288 |
| 2. | 20785 | 15.0% | 19.5%(-4.50)#23 | 20.1%(-5.10)#1,415 |
| 3. | 20782 | 27.0% | 19.5%(+7.50)#56 | 20.1%(+6.90)#2,676 |
| 4. | 20783 | 49.1% | 19.5%(+29.6)#88 | 20.1%(+29.0)#4,311 |
| 5. | 20781 | 49.5% | 19.5%(+30.0)#89 | 20.1%(+29.4)#4,329 |
1
Common Questions
What are the Top 3 Zip Codes with the Lowest Percentage of Births to Unmarried Women over the Age of 35 in Hyattsville, MD?
Top 3 Zip Codes with the Lowest Percentage of Births to Unmarried Women over the Age of 35 in Hyattsville, MD are:
What zip code has the Lowest Percentage of Births to Unmarried Women over the Age of 35 in Hyattsville, MD?
20784 has the Lowest Percentage of Births to Unmarried Women over the Age of 35 in Hyattsville, MD with 5.0%.
What is the Percentage of Births to Unmarried Women over the Age of 35 in Hyattsville, MD?
Percentage of Births to Unmarried Women over the Age of 35 in Hyattsville is 30.2%.
What is the Percentage of Births to Unmarried Women over the Age of 35 in Maryland?
Percentage of Births to Unmarried Women over the Age of 35 in Maryland is 19.5%.
What is the Percentage of Births to Unmarried Women over the Age of 35 in the United States?
Percentage of Births to Unmarried Women over the Age of 35 in the United States is 20.1%.