Zip Codes with the Highest Percentage of Population Employed in Arts, Entertainment & Recreation in Lawrence, MA
RELATED REPORTS & OPTIONS
Arts, Entertainment & Recreation
Lawrence
Compare Zip Codes
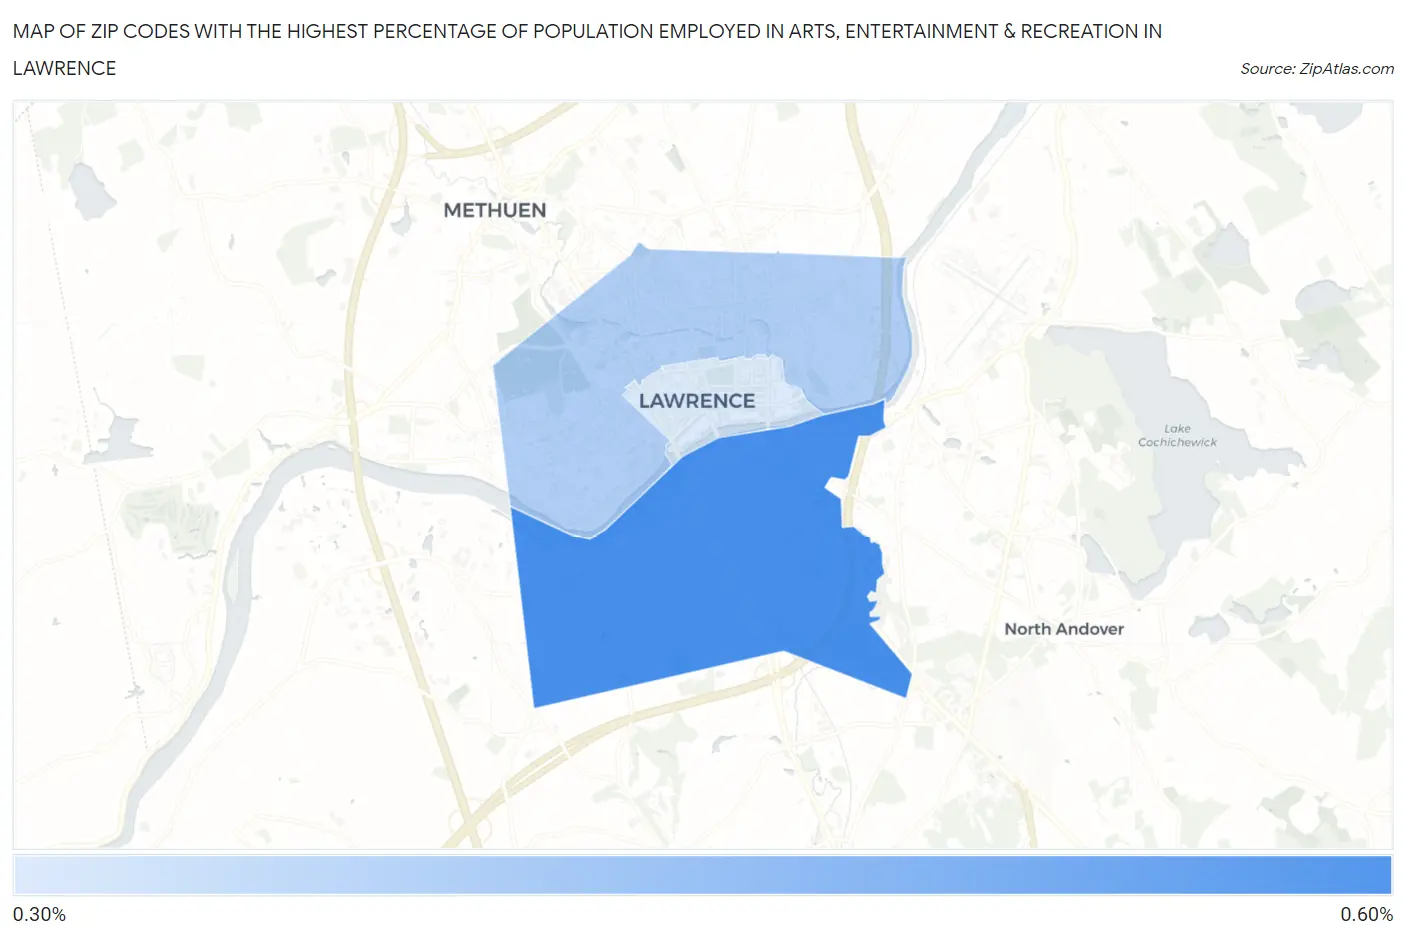
Map of Zip Codes with the Highest Percentage of Population Employed in Arts, Entertainment & Recreation in Lawrence
0.0%
0.60%
Zip Codes with the Highest Percentage of Population Employed in Arts, Entertainment & Recreation in Lawrence, MA
| Zip Code | % Employed | vs State | vs National | |
| 1. | 01843 | 0.57% | 2.0%(-1.41)#454 | 2.1%(-1.52)#20,054 |
| 2. | 01841 | 0.43% | 2.0%(-1.55)#467 | 2.1%(-1.65)#20,926 |
| 3. | 01840 | 0.37% | 2.0%(-1.61)#471 | 2.1%(-1.72)#21,314 |
1
Common Questions
What are the Top Zip Codes with the Highest Percentage of Population Employed in Arts, Entertainment & Recreation in Lawrence, MA?
Top Zip Codes with the Highest Percentage of Population Employed in Arts, Entertainment & Recreation in Lawrence, MA are:
What zip code has the Highest Percentage of Population Employed in Arts, Entertainment & Recreation in Lawrence, MA?
01843 has the Highest Percentage of Population Employed in Arts, Entertainment & Recreation in Lawrence, MA with 0.57%.
What is the Percentage of Population Employed in Arts, Entertainment & Recreation in Lawrence, MA?
Percentage of Population Employed in Arts, Entertainment & Recreation in Lawrence is 0.48%.
What is the Percentage of Population Employed in Arts, Entertainment & Recreation in Massachusetts?
Percentage of Population Employed in Arts, Entertainment & Recreation in Massachusetts is 2.0%.
What is the Percentage of Population Employed in Arts, Entertainment & Recreation in the United States?
Percentage of Population Employed in Arts, Entertainment & Recreation in the United States is 2.1%.