Zip Codes with the Highest Percentage of Population Employed in Arts, Entertainment & Recreation in North Easton, MA
RELATED REPORTS & OPTIONS
Arts, Entertainment & Recreation
North Easton
Compare Zip Codes
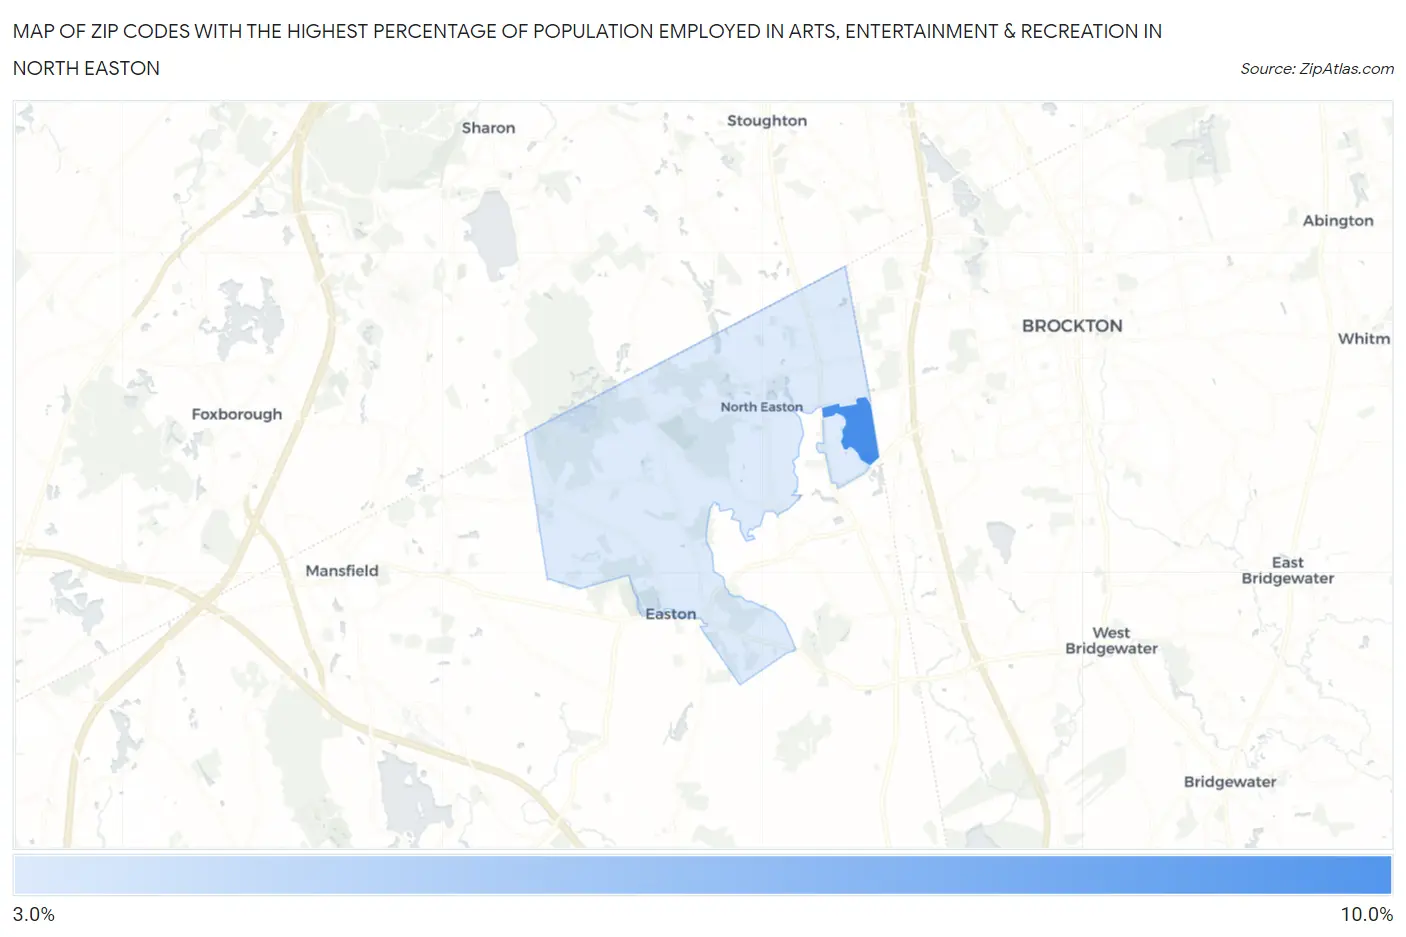
Map of Zip Codes with the Highest Percentage of Population Employed in Arts, Entertainment & Recreation in North Easton
3.5%
8.4%
Zip Codes with the Highest Percentage of Population Employed in Arts, Entertainment & Recreation in North Easton, MA
| Zip Code | % Employed | vs State | vs National | |
| 1. | 02357 | 8.4% | 2.0%(+6.45)#12 | 2.1%(+6.34)#962 |
| 2. | 02356 | 3.5% | 2.0%(+1.53)#88 | 2.1%(+1.43)#4,105 |
1
Common Questions
What are the Top Zip Codes with the Highest Percentage of Population Employed in Arts, Entertainment & Recreation in North Easton, MA?
Top Zip Codes with the Highest Percentage of Population Employed in Arts, Entertainment & Recreation in North Easton, MA are:
What zip code has the Highest Percentage of Population Employed in Arts, Entertainment & Recreation in North Easton, MA?
02357 has the Highest Percentage of Population Employed in Arts, Entertainment & Recreation in North Easton, MA with 8.4%.
What is the Percentage of Population Employed in Arts, Entertainment & Recreation in Massachusetts?
Percentage of Population Employed in Arts, Entertainment & Recreation in Massachusetts is 2.0%.
What is the Percentage of Population Employed in Arts, Entertainment & Recreation in the United States?
Percentage of Population Employed in Arts, Entertainment & Recreation in the United States is 2.1%.