Zip Codes with the Highest Percentage of Population Employed in Office & Administration in Lowell, MA
RELATED REPORTS & OPTIONS
Office & Administration
Lowell
Compare Zip Codes
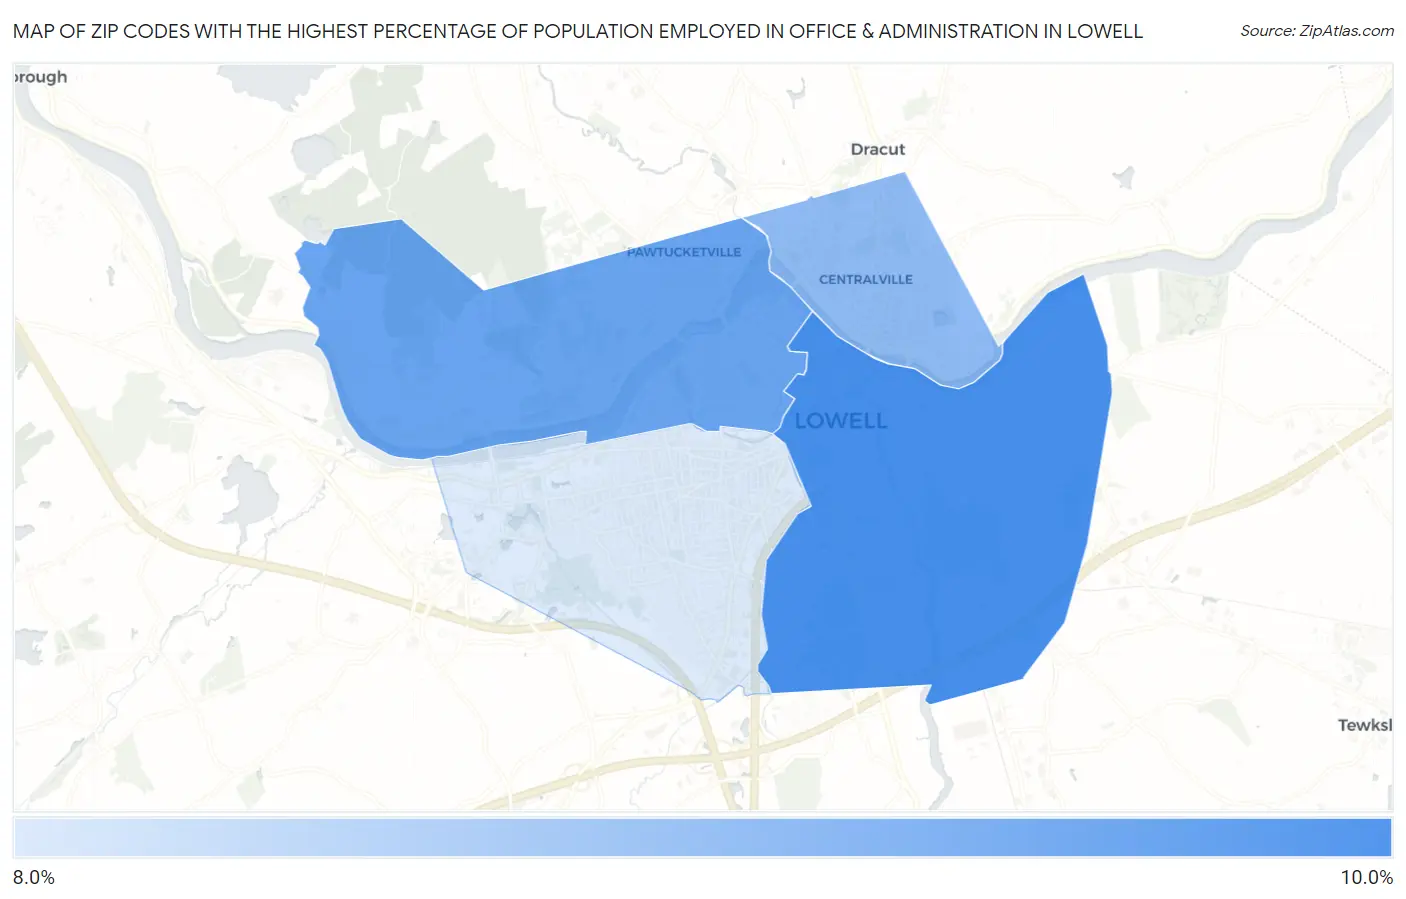
Map of Zip Codes with the Highest Percentage of Population Employed in Office & Administration in Lowell
8.1%
10.0%
Zip Codes with the Highest Percentage of Population Employed in Office & Administration in Lowell, MA
| Zip Code | % Employed | vs State | vs National | |
| 1. | 01852 | 10.0% | 9.6%(+0.375)#223 | 10.9%(-0.873)#17,194 |
| 2. | 01854 | 9.6% | 9.6%(-0.042)#243 | 10.9%(-1.29)#18,526 |
| 3. | 01850 | 9.1% | 9.6%(-0.499)#274 | 10.9%(-1.75)#19,923 |
| 4. | 01851 | 8.1% | 9.6%(-1.46)#346 | 10.9%(-2.71)#22,672 |
1
Common Questions
What are the Top 3 Zip Codes with the Highest Percentage of Population Employed in Office & Administration in Lowell, MA?
Top 3 Zip Codes with the Highest Percentage of Population Employed in Office & Administration in Lowell, MA are:
What zip code has the Highest Percentage of Population Employed in Office & Administration in Lowell, MA?
01852 has the Highest Percentage of Population Employed in Office & Administration in Lowell, MA with 10.0%.
What is the Percentage of Population Employed in Office & Administration in Lowell, MA?
Percentage of Population Employed in Office & Administration in Lowell is 9.2%.
What is the Percentage of Population Employed in Office & Administration in Massachusetts?
Percentage of Population Employed in Office & Administration in Massachusetts is 9.6%.
What is the Percentage of Population Employed in Office & Administration in the United States?
Percentage of Population Employed in Office & Administration in the United States is 10.9%.