Zip Codes with the Highest Percentage of Population with a Degree in Visual and Performing Arts in Framingham, MA
RELATED REPORTS & OPTIONS
Visual and Performing Arts
Framingham
Compare Zip Codes
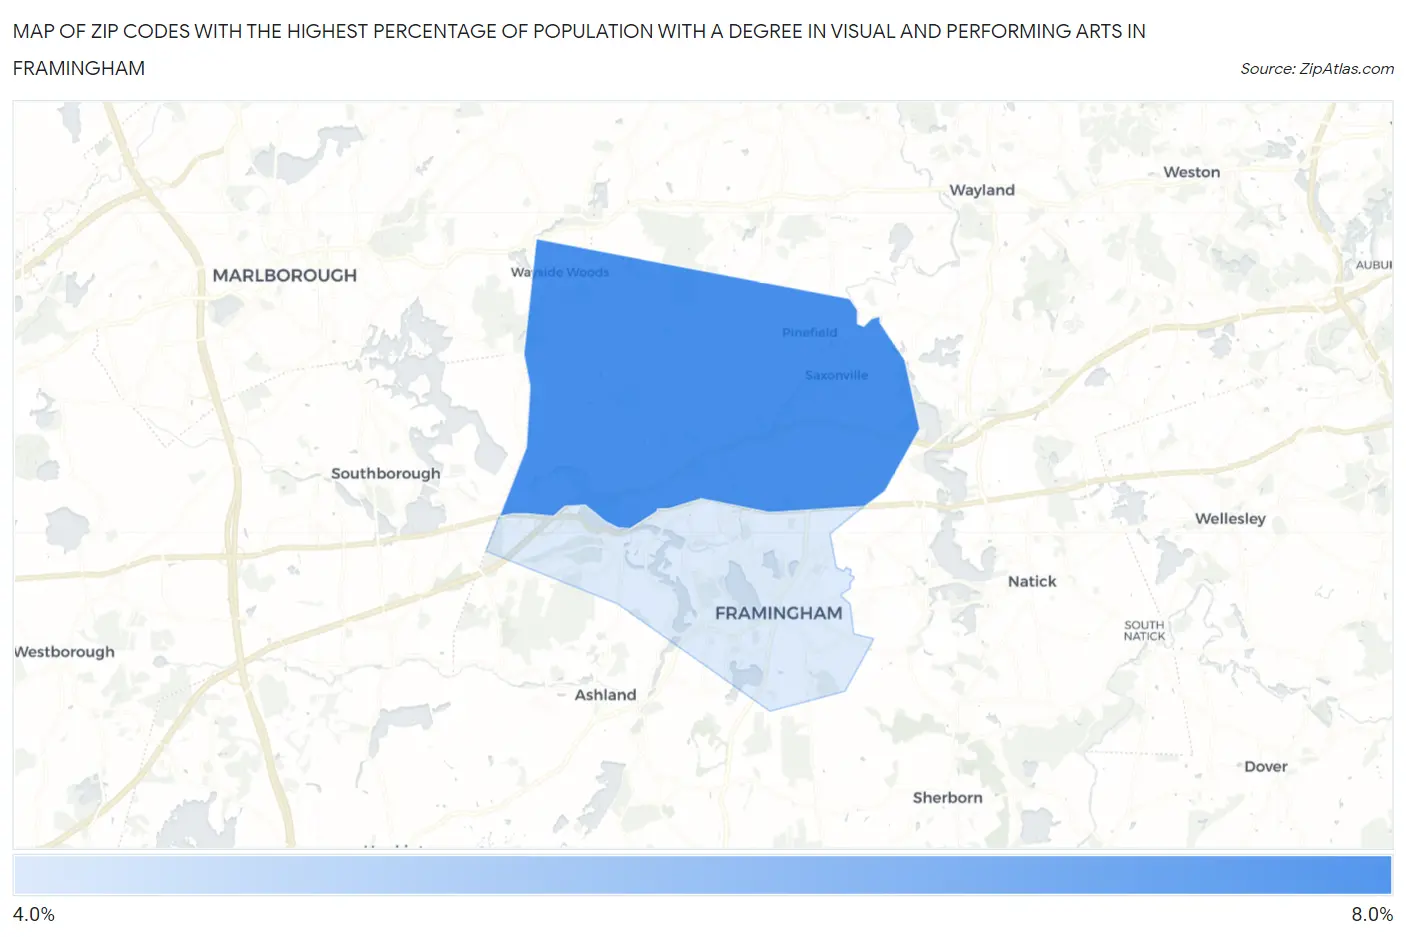
Map of Zip Codes with the Highest Percentage of Population with a Degree in Visual and Performing Arts in Framingham
4.9%
6.0%
Zip Codes with the Highest Percentage of Population with a Degree in Visual and Performing Arts in Framingham, MA
| Zip Code | % Graduates | vs State | vs National | |
| 1. | 01701 | 6.0% | 4.7%(+1.33)#133 | 4.3%(+1.79)#4,816 |
| 2. | 01702 | 4.9% | 4.7%(+0.141)#216 | 4.3%(+0.603)#6,959 |
1
Common Questions
What are the Top Zip Codes with the Highest Percentage of Population with a Degree in Visual and Performing Arts in Framingham, MA?
Top Zip Codes with the Highest Percentage of Population with a Degree in Visual and Performing Arts in Framingham, MA are:
What zip code has the Highest Percentage of Population with a Degree in Visual and Performing Arts in Framingham, MA?
01701 has the Highest Percentage of Population with a Degree in Visual and Performing Arts in Framingham, MA with 6.0%.
What is the Percentage of Population with a Degree in Visual and Performing Arts in Framingham, MA?
Percentage of Population with a Degree in Visual and Performing Arts in Framingham is 5.6%.
What is the Percentage of Population with a Degree in Visual and Performing Arts in Massachusetts?
Percentage of Population with a Degree in Visual and Performing Arts in Massachusetts is 4.7%.
What is the Percentage of Population with a Degree in Visual and Performing Arts in the United States?
Percentage of Population with a Degree in Visual and Performing Arts in the United States is 4.3%.