Zip Codes with the Highest Percentage of Population with a Degree in Visual and Performing Arts in Quincy, MA
RELATED REPORTS & OPTIONS
Visual and Performing Arts
Quincy
Compare Zip Codes
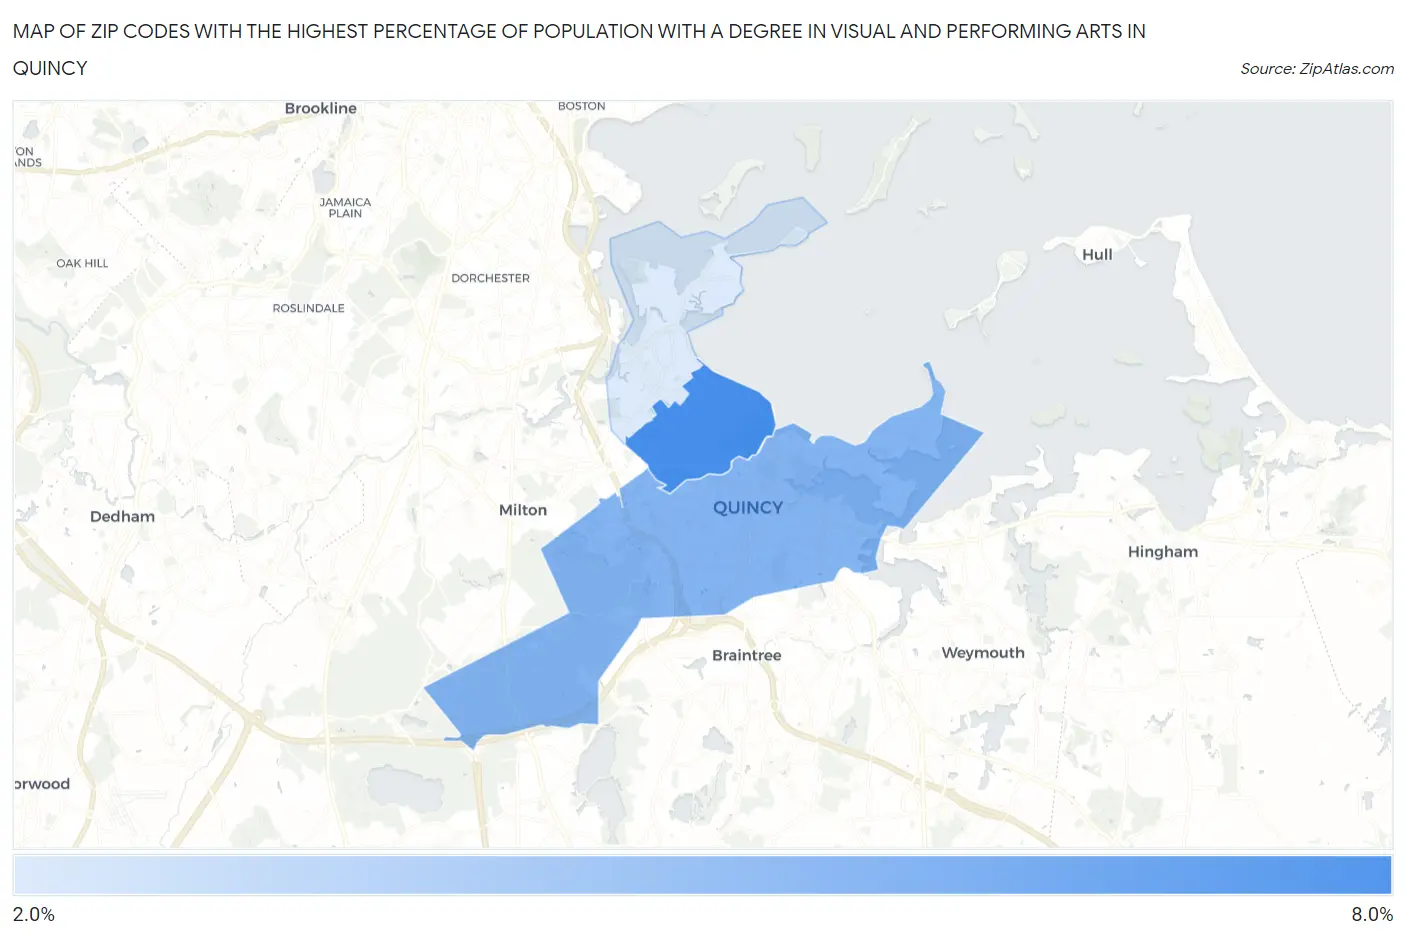
Map of Zip Codes with the Highest Percentage of Population with a Degree in Visual and Performing Arts in Quincy
2.2%
6.4%
Zip Codes with the Highest Percentage of Population with a Degree in Visual and Performing Arts in Quincy, MA
| Zip Code | % Graduates | vs State | vs National | |
| 1. | 02170 | 6.4% | 4.7%(+1.68)#111 | 4.3%(+2.14)#4,354 |
| 2. | 02169 | 4.7% | 4.7%(-0.007)#227 | 4.3%(+0.455)#7,284 |
| 3. | 02171 | 2.2% | 4.7%(-2.56)#425 | 4.3%(-2.10)#15,875 |
1
Common Questions
What are the Top Zip Codes with the Highest Percentage of Population with a Degree in Visual and Performing Arts in Quincy, MA?
Top Zip Codes with the Highest Percentage of Population with a Degree in Visual and Performing Arts in Quincy, MA are:
What zip code has the Highest Percentage of Population with a Degree in Visual and Performing Arts in Quincy, MA?
02170 has the Highest Percentage of Population with a Degree in Visual and Performing Arts in Quincy, MA with 6.4%.
What is the Percentage of Population with a Degree in Visual and Performing Arts in Quincy, MA?
Percentage of Population with a Degree in Visual and Performing Arts in Quincy is 4.4%.
What is the Percentage of Population with a Degree in Visual and Performing Arts in Massachusetts?
Percentage of Population with a Degree in Visual and Performing Arts in Massachusetts is 4.7%.
What is the Percentage of Population with a Degree in Visual and Performing Arts in the United States?
Percentage of Population with a Degree in Visual and Performing Arts in the United States is 4.3%.