Yup'ik vs Immigrants from Nigeria In Labor Force | Age 35-44
COMPARE
Yup'ik
Immigrants from Nigeria
In Labor Force | Age 35-44
In Labor Force | Age 35-44 Comparison
Yup'ik
Immigrants from Nigeria
77.3%
IN LABOR FORCE | AGE 35-44
0.0/ 100
METRIC RATING
339th/ 347
METRIC RANK
84.5%
IN LABOR FORCE | AGE 35-44
73.3/ 100
METRIC RATING
150th/ 347
METRIC RANK
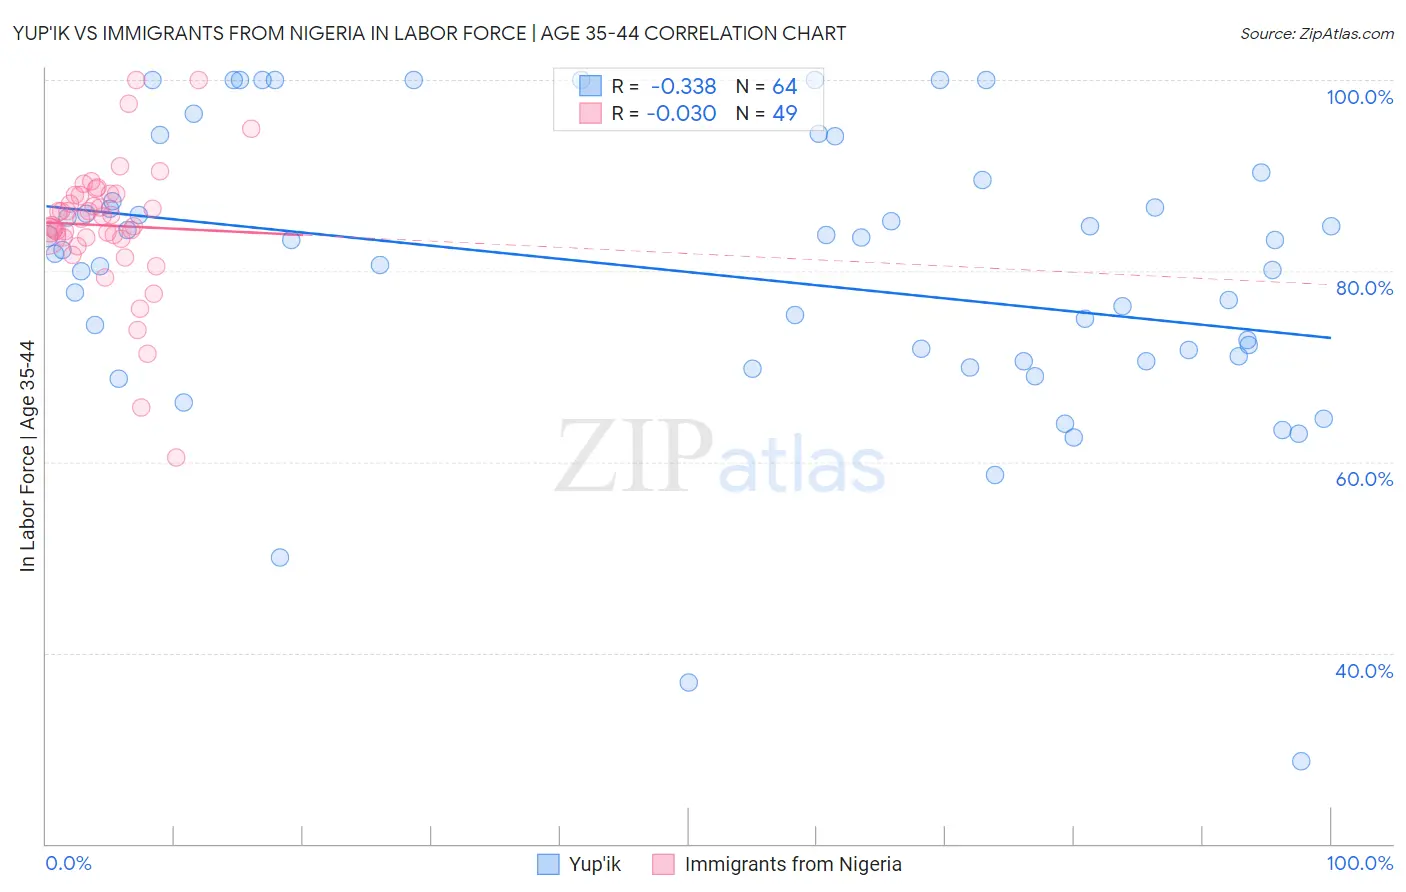
Yup'ik vs Immigrants from Nigeria In Labor Force | Age 35-44 Correlation Chart
The statistical analysis conducted on geographies consisting of 39,956,456 people shows a mild negative correlation between the proportion of Yup'ik and labor force participation rate among population between the ages 35 and 44 in the United States with a correlation coefficient (R) of -0.338 and weighted average of 77.3%. Similarly, the statistical analysis conducted on geographies consisting of 283,331,334 people shows no correlation between the proportion of Immigrants from Nigeria and labor force participation rate among population between the ages 35 and 44 in the United States with a correlation coefficient (R) of -0.030 and weighted average of 84.5%, a difference of 9.4%.
In Labor Force | Age 35-44 Correlation Summary
| Measurement | Yup'ik | Immigrants from Nigeria |
| Minimum | 28.6% | 60.5% |
| Maximum | 100.0% | 100.0% |
| Range | 71.4% | 39.5% |
| Mean | 79.8% | 84.8% |
| Median | 82.0% | 85.4% |
| Interquartile 25% (IQ1) | 70.8% | 83.4% |
| Interquartile 75% (IQ3) | 88.4% | 88.0% |
| Interquartile Range (IQR) | 17.6% | 4.6% |
| Standard Deviation (Sample) | 14.9% | 7.1% |
| Standard Deviation (Population) | 14.8% | 7.0% |
Similar Demographics by In Labor Force | Age 35-44
Demographics Similar to Yup'ik by In Labor Force | Age 35-44
In terms of in labor force | age 35-44, the demographic groups most similar to Yup'ik are Pueblo (77.4%, a difference of 0.10%), Lumbee (77.0%, a difference of 0.35%), Hopi (77.0%, a difference of 0.40%), Apache (77.9%, a difference of 0.81%), and Arapaho (78.1%, a difference of 1.0%).
| Demographics | Rating | Rank | In Labor Force | Age 35-44 |
| Ute | 0.0 /100 | #332 | Tragic 79.4% |
| Kiowa | 0.0 /100 | #333 | Tragic 79.2% |
| Yakama | 0.0 /100 | #334 | Tragic 79.0% |
| Natives/Alaskans | 0.0 /100 | #335 | Tragic 78.9% |
| Arapaho | 0.0 /100 | #336 | Tragic 78.1% |
| Apache | 0.0 /100 | #337 | Tragic 77.9% |
| Pueblo | 0.0 /100 | #338 | Tragic 77.4% |
| Yup'ik | 0.0 /100 | #339 | Tragic 77.3% |
| Lumbee | 0.0 /100 | #340 | Tragic 77.0% |
| Hopi | 0.0 /100 | #341 | Tragic 77.0% |
| Crow | 0.0 /100 | #342 | Tragic 76.5% |
| Immigrants | Yemen | 0.0 /100 | #343 | Tragic 76.3% |
| Pima | 0.0 /100 | #344 | Tragic 74.8% |
| Yuman | 0.0 /100 | #345 | Tragic 74.7% |
| Tohono O'odham | 0.0 /100 | #346 | Tragic 74.1% |
Demographics Similar to Immigrants from Nigeria by In Labor Force | Age 35-44
In terms of in labor force | age 35-44, the demographic groups most similar to Immigrants from Nigeria are South American Indian (84.5%, a difference of 0.0%), Okinawan (84.5%, a difference of 0.0%), Romanian (84.5%, a difference of 0.010%), Immigrants from Taiwan (84.5%, a difference of 0.020%), and Immigrants from Netherlands (84.5%, a difference of 0.030%).
| Demographics | Rating | Rank | In Labor Force | Age 35-44 |
| Immigrants | Ukraine | 79.7 /100 | #143 | Good 84.6% |
| Immigrants | Jamaica | 79.4 /100 | #144 | Good 84.6% |
| Immigrants | Saudi Arabia | 79.4 /100 | #145 | Good 84.6% |
| Immigrants | Asia | 78.7 /100 | #146 | Good 84.5% |
| Immigrants | Netherlands | 76.6 /100 | #147 | Good 84.5% |
| South American Indians | 73.6 /100 | #148 | Good 84.5% |
| Okinawans | 73.5 /100 | #149 | Good 84.5% |
| Immigrants | Nigeria | 73.3 /100 | #150 | Good 84.5% |
| Romanians | 72.1 /100 | #151 | Good 84.5% |
| Immigrants | Taiwan | 71.4 /100 | #152 | Good 84.5% |
| Trinidadians and Tobagonians | 69.5 /100 | #153 | Good 84.5% |
| Iranians | 69.4 /100 | #154 | Good 84.5% |
| Immigrants | Switzerland | 65.9 /100 | #155 | Good 84.5% |
| Immigrants | Israel | 64.3 /100 | #156 | Good 84.4% |
| Immigrants | Austria | 63.8 /100 | #157 | Good 84.4% |