Sioux vs Choctaw In Labor Force | Age 16-19

COMPARE

Sioux
Race
Ancestry
AfghanAfricanAlaska NativeAlaskan AthabascanAlbanianAleutAlsatianAmericanApacheArabArapahoArgentineanArmenianAssyrian/Chaldean/SyriacAustralianAustrianBahamianBangladeshiBarbadianBasqueBelgianBelizeanBermudanBhutaneseBlackfeetBolivianBrazilianBritishBritish West IndianBulgarianBurmeseCajunCambodianCanadianCape VerdeanCarpatho RusynCelticCentral AmericanCentral American IndianCherokeeCheyenneChickasawChileanChineseChippewaColombianColvilleComancheCosta RicanCreeCreekCroatianCrowCubanCypriotCzechCzechoslovakianDanishDelawareDominicanDutchDutch West IndianEastern EuropeanEcuadorianEgyptianEnglishEstonianEthiopianEuropeanFijianFilipinoFinnishFrenchFrench American IndianFrench CanadianGermanGerman RussianGhanaianGreekGuamanian/ChamorroGuatemalanGuyaneseHaitianHmongHonduranHopiHoumaHungarianIcelanderIndian (Asian)IndonesianInupiatIranianIraqiIrishIroquoisIsraeliItalianJamaicanJapaneseJordanianKenyanKiowaKoreanLaotianLatvianLebaneseLiberianLithuanianLumbeeLuxembourgerMacedonianMalaysianMalteseMarshalleseMenomineeMexicanMexican American IndianMongolianMoroccanNative HawaiianNavajoNepaleseNew ZealanderNicaraguanNigerianNorthern EuropeanNorwegianOkinawanOsageOttawaPaiutePakistaniPalestinianPanamanianParaguayanPennsylvania GermanPeruvianPimaPolishPortuguesePotawatomiPuebloPuerto RicanPuget Sound SalishRomanianRussianSalvadoranSamoanScandinavianScotch-IrishScottishSeminoleSenegaleseSerbianShoshoneSierra LeoneanSiouxSlavicSlovakSloveneSomaliSouth AfricanSouth AmericanSouth American IndianSoviet UnionSpaniardSpanishSpanish AmericanSpanish American IndianSri LankanSubsaharan AfricanSudaneseSwedishSwissSyrianTaiwaneseThaiTlingit-HaidaTohono O'OdhamTonganTrinidadian and TobagonianTsimshianTurkishU.S. Virgin IslanderUgandanUkrainianUruguayanUteVenezuelanVietnameseWelshWest IndianYakamaYaquiYugoslavianYumanYup'ikZimbabwean
Immigration
NonimmigrantsImmigrantsAfghanistanAfricaAlbaniaArgentinaArmeniaAsiaAustraliaAustriaBahamasBangladeshBarbadosBelarusBelgiumBelizeBoliviaBosnia and HerzegovinaBrazilBulgariaBurma/MyanmarCabo VerdeCambodiaCameroonCanadaCaribbeanCentral AmericaChileChinaColombiaCongoCosta RicaCroatiaCubaCzechoslovakiaDenmarkDominicaDominican RepublicEastern AfricaEastern AsiaEastern EuropeEcuadorEgyptEl SalvadorEnglandEritreaEthiopiaEuropeFijiFranceGermanyGhanaGreeceGrenadaGuatemalaGuyanaHaitiHondurasHong KongHungaryIndiaIndonesiaIranIraqIrelandIsraelItalyJamaicaJapanJordanKazakhstanKenyaKoreaKuwaitLaosLatin AmericaLatviaLebanonLiberiaLithuaniaMalaysiaMexicoMicronesiaMiddle AfricaMoldovaMoroccoNepalNetherlandsNicaraguaNigeriaNorth AmericaNorth MacedoniaNorthern AfricaNorthern EuropeNorwayOceaniaPakistanPanamaPeruPhilippinesPolandPortugalRomaniaRussiaSaudi ArabiaScotlandSenegalSerbiaSierra LeoneSingaporeSomaliaSouth AfricaSouth AmericaSouth Central AsiaSouth Eastern AsiaSouthern EuropeSpainSri LankaSt. Vincent and the GrenadinesSudanSwedenSwitzerlandSyriaTaiwanThailandTrinidad and TobagoTurkeyUgandaUkraineUruguayUzbekistanVenezuelaVietnamWest IndiesWestern AfricaWestern AsiaWestern EuropeYemenZaireZimbabweAzores
Choctaw
Race
Ancestry
AfghanAfricanAlaska NativeAlaskan AthabascanAlbanianAleutAlsatianAmericanApacheArabArapahoArgentineanArmenianAssyrian/Chaldean/SyriacAustralianAustrianBahamianBangladeshiBarbadianBasqueBelgianBelizeanBermudanBhutaneseBlackfeetBolivianBrazilianBritishBritish West IndianBulgarianBurmeseCajunCambodianCanadianCape VerdeanCarpatho RusynCelticCentral AmericanCentral American IndianCherokeeCheyenneChickasawChileanChineseChippewaChoctawColombianColvilleComancheCosta RicanCreeCreekCroatianCrowCubanCypriotCzechCzechoslovakianDanishDelawareDominicanDutchDutch West IndianEastern EuropeanEcuadorianEgyptianEnglishEstonianEthiopianEuropeanFijianFilipinoFinnishFrenchFrench American IndianFrench CanadianGermanGerman RussianGhanaianGreekGuamanian/ChamorroGuatemalanGuyaneseHaitianHmongHonduranHopiHoumaHungarianIcelanderIndian (Asian)IndonesianInupiatIranianIraqiIrishIroquoisIsraeliItalianJamaicanJapaneseJordanianKenyanKiowaKoreanLaotianLatvianLebaneseLiberianLithuanianLumbeeLuxembourgerMacedonianMalaysianMalteseMarshalleseMenomineeMexicanMexican American IndianMongolianMoroccanNative HawaiianNavajoNepaleseNew ZealanderNicaraguanNigerianNorthern EuropeanNorwegianOkinawanOsageOttawaPaiutePakistaniPalestinianPanamanianParaguayanPennsylvania GermanPeruvianPimaPolishPortuguesePotawatomiPuebloPuerto RicanPuget Sound SalishRomanianRussianSalvadoranSamoanScandinavianScotch-IrishScottishSeminoleSenegaleseSerbianShoshoneSierra LeoneanSlavicSlovakSloveneSomaliSouth AfricanSouth AmericanSouth American IndianSoviet UnionSpaniardSpanishSpanish AmericanSpanish American IndianSri LankanSubsaharan AfricanSudaneseSwedishSwissSyrianTaiwaneseThaiTlingit-HaidaTohono O'OdhamTonganTrinidadian and TobagonianTsimshianTurkishU.S. Virgin IslanderUgandanUkrainianUruguayanUteVenezuelanVietnameseWelshWest IndianYakamaYaquiYugoslavianYumanYup'ikZimbabwean
Immigration
NonimmigrantsImmigrantsAfghanistanAfricaAlbaniaArgentinaArmeniaAsiaAustraliaAustriaBahamasBangladeshBarbadosBelarusBelgiumBelizeBoliviaBosnia and HerzegovinaBrazilBulgariaBurma/MyanmarCabo VerdeCambodiaCameroonCanadaCaribbeanCentral AmericaChileChinaColombiaCongoCosta RicaCroatiaCubaCzechoslovakiaDenmarkDominicaDominican RepublicEastern AfricaEastern AsiaEastern EuropeEcuadorEgyptEl SalvadorEnglandEritreaEthiopiaEuropeFijiFranceGermanyGhanaGreeceGrenadaGuatemalaGuyanaHaitiHondurasHong KongHungaryIndiaIndonesiaIranIraqIrelandIsraelItalyJamaicaJapanJordanKazakhstanKenyaKoreaKuwaitLaosLatin AmericaLatviaLebanonLiberiaLithuaniaMalaysiaMexicoMicronesiaMiddle AfricaMoldovaMoroccoNepalNetherlandsNicaraguaNigeriaNorth AmericaNorth MacedoniaNorthern AfricaNorthern EuropeNorwayOceaniaPakistanPanamaPeruPhilippinesPolandPortugalRomaniaRussiaSaudi ArabiaScotlandSenegalSerbiaSierra LeoneSingaporeSomaliaSouth AfricaSouth AmericaSouth Central AsiaSouth Eastern AsiaSouthern EuropeSpainSri LankaSt. Vincent and the GrenadinesSudanSwedenSwitzerlandSyriaTaiwanThailandTrinidad and TobagoTurkeyUgandaUkraineUruguayUzbekistanVenezuelaVietnamWest IndiesWestern AfricaWestern AsiaWestern EuropeYemenZaireZimbabweAzores
In Labor Force | Age 16-19
Income
Poverty
Unemployment
Labor Participation
Family Structure
Vehicle Availability
Education Level
Disability

In Labor Force | Age 16-19 Comparison

Sioux

Choctaw

Exceptional
Exceptional
41.5%
IN LABOR FORCE | AGE 16-19
100.0/ 100
METRIC RATING
38th/ 347
METRIC RANK
38.0%
IN LABOR FORCE | AGE 16-19
95.6/ 100
METRIC RATING
127th/ 347
METRIC RANK

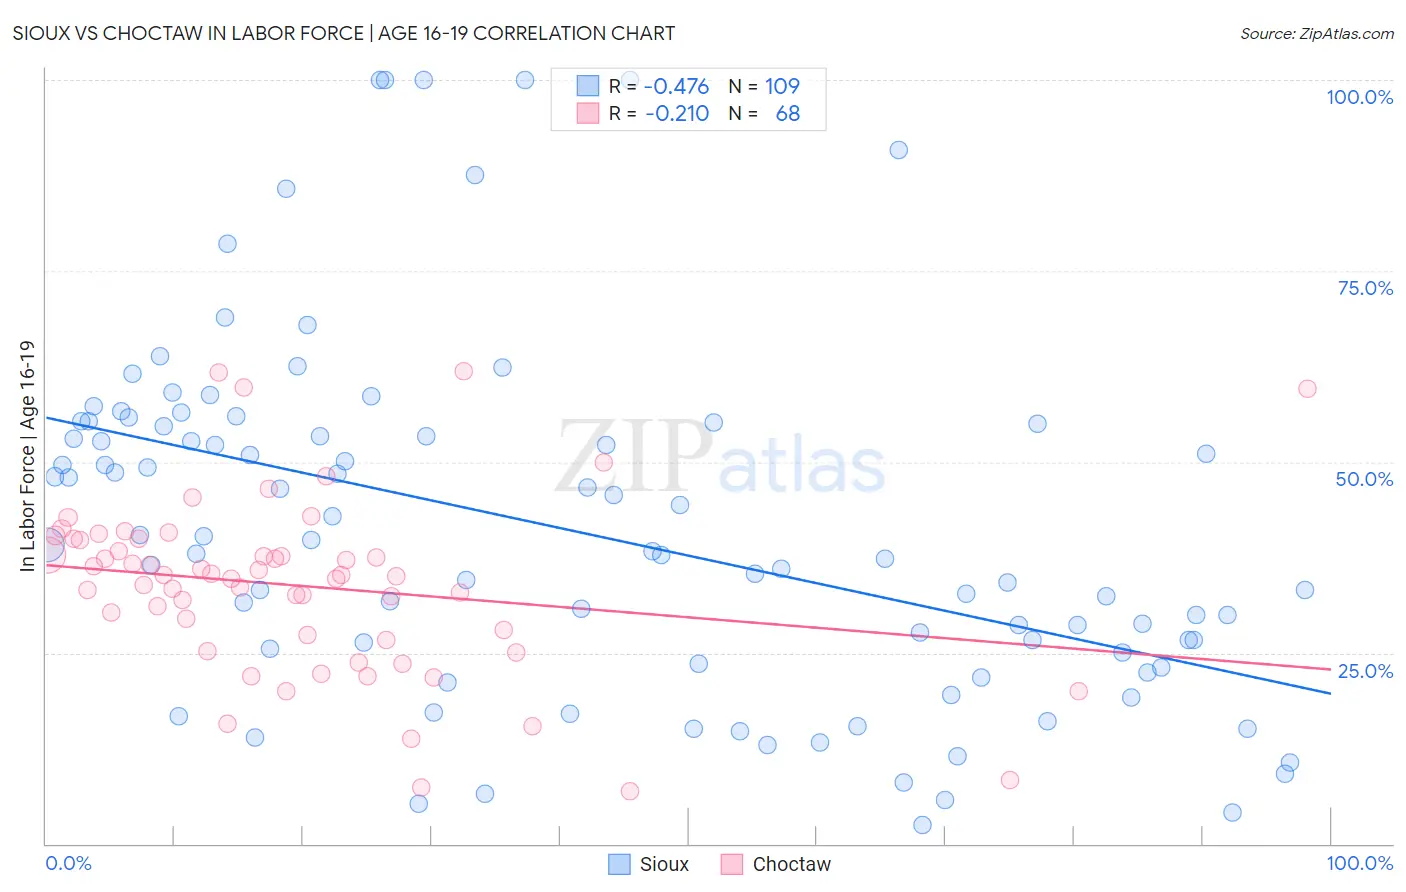
Sioux vs Choctaw In Labor Force | Age 16-19 Correlation Chart

The statistical analysis conducted on geographies consisting of 233,888,038 people shows a moderate negative correlation between the proportion of Sioux and labor force participation rate among population between the ages 16 and 19 in the United States with a correlation coefficient (R) of -0.476 and weighted average of 41.5%. Similarly, the statistical analysis conducted on geographies consisting of 269,371,385 people shows a weak negative correlation between the proportion of Choctaw and labor force participation rate among population between the ages 16 and 19 in the United States with a correlation coefficient (R) of -0.210 and weighted average of 38.0%, a difference of 9.4%.
Sioux vs Choctaw In Labor Force | Age 16-19

In Labor Force | Age 16-19 Correlation Summary

MeasurementSiouxChoctaw
Minimum2.4%6.9%
Maximum100.0%61.9%
Range97.6%55.0%
Mean41.1%33.8%
Median38.3%35.1%
Interquartile 25% (IQ1)24.2%27.0%
Interquartile 75% (IQ3)54.9%39.9%
Interquartile Range (IQR)30.6%12.8%
Standard Deviation (Sample)23.0%11.5%
Standard Deviation (Population)22.9%11.5%

Similar Demographics by In Labor Force | Age 16-19

Demographics Similar to Sioux by In Labor Force | Age 16-19

In terms of in labor force | age 16-19, the demographic groups most similar to Sioux are Scotch-Irish (41.5%, a difference of 0.14%), Immigrants from Liberia (41.5%, a difference of 0.23%), Immigrants from Congo (41.7%, a difference of 0.35%), Immigrants from the Azores (41.7%, a difference of 0.42%), and Yugoslavian (41.8%, a difference of 0.57%).
DemographicsRating | RankIn Labor Force | Age 16-19
Irish
100.0
/100
|
#31
Exceptional
42.0%
Czechoslovakians
100.0
/100
|
#32
Exceptional
41.9%
Liberians
100.0
/100
|
#33
Exceptional
41.8%
Immigrants | Bosnia and Herzegovina
100.0
/100
|
#34
Exceptional
41.8%
Yugoslavians
100.0
/100
|
#35
Exceptional
41.8%
Immigrants | Azores
100.0
/100
|
#36
Exceptional
41.7%
Immigrants | Congo
100.0
/100
|
#37
Exceptional
41.7%
Sioux
100.0
/100
|
#38
Exceptional
41.5%
Scotch-Irish
100.0
/100
|
#39
Exceptional
41.5%
Immigrants | Liberia
100.0
/100
|
#40
Exceptional
41.5%
Celtics
100.0
/100
|
#41
Exceptional
41.3%
Whites/Caucasians
100.0
/100
|
#42
Exceptional
41.3%
Tongans
100.0
/100
|
#43
Exceptional
41.2%
Europeans
100.0
/100
|
#44
Exceptional
41.1%
Croatians
100.0
/100
|
#45
Exceptional
41.1%

Demographics Similar to Choctaw by In Labor Force | Age 16-19

In terms of in labor force | age 16-19, the demographic groups most similar to Choctaw are New Zealander (38.0%, a difference of 0.0%), African (38.0%, a difference of 0.010%), Spaniard (38.0%, a difference of 0.030%), Immigrants from Zimbabwe (38.0%, a difference of 0.060%), and Immigrants from Austria (37.9%, a difference of 0.15%).
DemographicsRating | RankIn Labor Force | Age 16-19
Ukrainians
97.6
/100
|
#120
Exceptional
38.3%
Ethiopians
97.4
/100
|
#121
Exceptional
38.2%
Guamanians/Chamorros
97.4
/100
|
#122
Exceptional
38.2%
Seminole
96.7
/100
|
#123
Exceptional
38.1%
Immigrants | England
96.4
/100
|
#124
Exceptional
38.1%
Immigrants | Africa
96.1
/100
|
#125
Exceptional
38.0%
Africans
95.6
/100
|
#126
Exceptional
38.0%
Choctaw
95.6
/100
|
#127
Exceptional
38.0%
New Zealanders
95.6
/100
|
#128
Exceptional
38.0%
Spaniards
95.5
/100
|
#129
Exceptional
38.0%
Immigrants | Zimbabwe
95.4
/100
|
#130
Exceptional
38.0%
Immigrants | Austria
95.0
/100
|
#131
Exceptional
37.9%
Immigrants | Oceania
94.7
/100
|
#132
Exceptional
37.9%
Cheyenne
94.6
/100
|
#133
Exceptional
37.9%
Immigrants | Netherlands
93.7
/100
|
#134
Exceptional
37.8%