Puerto Rican vs Thai In Labor Force | Age 20-24
COMPARE
Puerto Rican
Thai
In Labor Force | Age 20-24
In Labor Force | Age 20-24 Comparison
Puerto Ricans
Thais
68.3%
IN LABOR FORCE | AGE 20-24
0.0/ 100
METRIC RATING
343rd/ 347
METRIC RANK
74.0%
IN LABOR FORCE | AGE 20-24
2.1/ 100
METRIC RATING
242nd/ 347
METRIC RANK
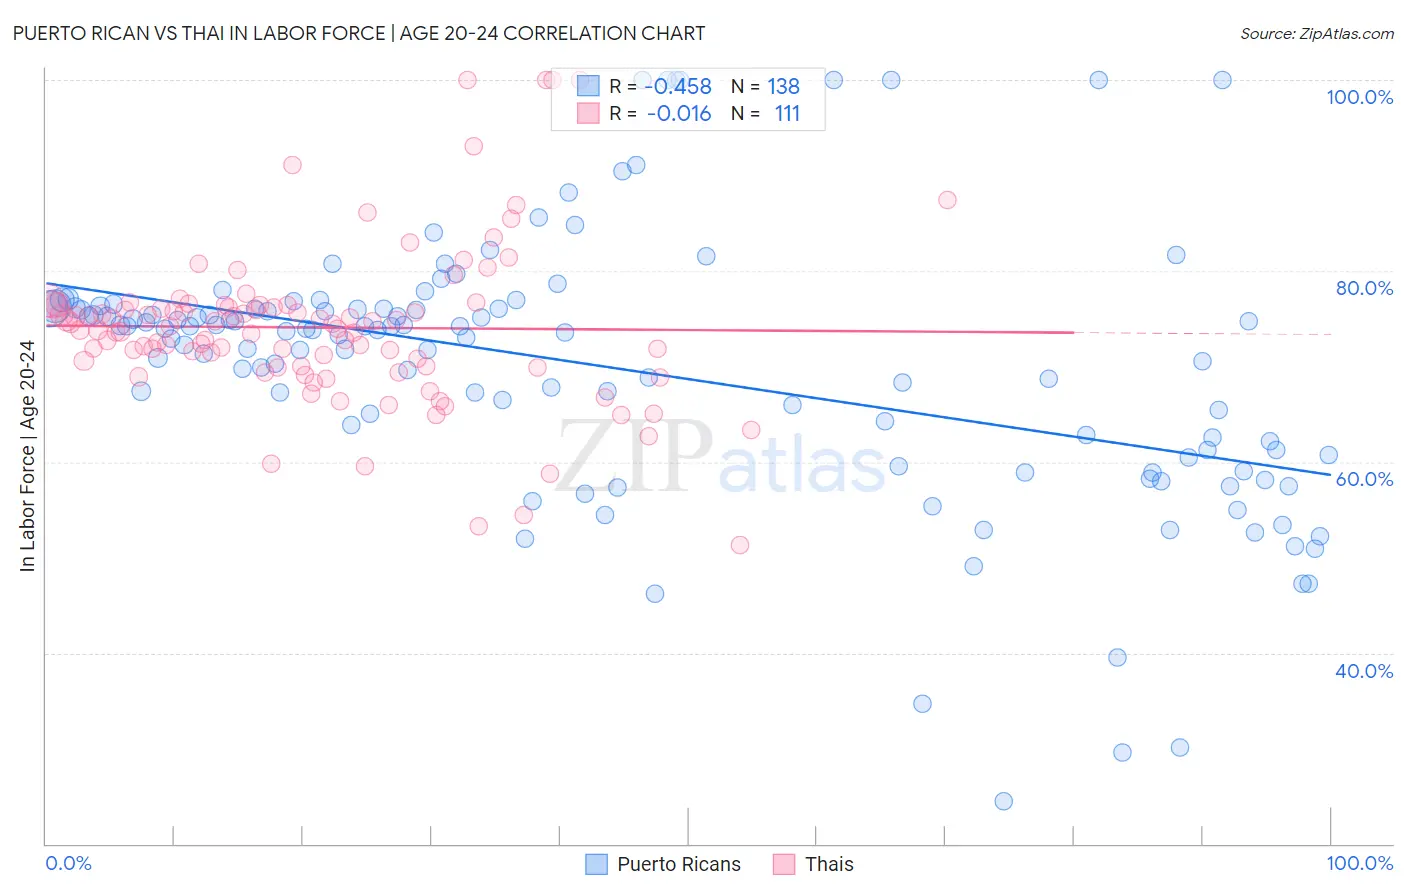
Puerto Rican vs Thai In Labor Force | Age 20-24 Correlation Chart
The statistical analysis conducted on geographies consisting of 527,810,286 people shows a moderate negative correlation between the proportion of Puerto Ricans and labor force participation rate among population between the ages 20 and 24 in the United States with a correlation coefficient (R) of -0.458 and weighted average of 68.3%. Similarly, the statistical analysis conducted on geographies consisting of 475,671,796 people shows no correlation between the proportion of Thais and labor force participation rate among population between the ages 20 and 24 in the United States with a correlation coefficient (R) of -0.016 and weighted average of 74.0%, a difference of 8.3%.
In Labor Force | Age 20-24 Correlation Summary
| Measurement | Puerto Rican | Thai |
| Minimum | 24.4% | 51.3% |
| Maximum | 100.0% | 100.0% |
| Range | 75.6% | 48.7% |
| Mean | 69.9% | 74.1% |
| Median | 73.6% | 73.9% |
| Interquartile 25% (IQ1) | 61.2% | 70.0% |
| Interquartile 75% (IQ3) | 76.1% | 76.5% |
| Interquartile Range (IQR) | 14.9% | 6.5% |
| Standard Deviation (Sample) | 13.9% | 8.4% |
| Standard Deviation (Population) | 13.9% | 8.3% |
Similar Demographics by In Labor Force | Age 20-24
Demographics Similar to Puerto Ricans by In Labor Force | Age 20-24
In terms of in labor force | age 20-24, the demographic groups most similar to Puerto Ricans are Immigrants from St. Vincent and the Grenadines (68.4%, a difference of 0.12%), Tohono O'odham (68.6%, a difference of 0.43%), Menominee (68.7%, a difference of 0.56%), Immigrants from Yemen (68.9%, a difference of 0.87%), and Pima (69.0%, a difference of 1.0%).
| Demographics | Rating | Rank | In Labor Force | Age 20-24 |
| Yuman | 0.0 /100 | #333 | Tragic 70.3% |
| British West Indians | 0.0 /100 | #334 | Tragic 70.0% |
| Immigrants | Barbados | 0.0 /100 | #335 | Tragic 69.7% |
| Immigrants | Guyana | 0.0 /100 | #336 | Tragic 69.3% |
| Guyanese | 0.0 /100 | #337 | Tragic 69.2% |
| Pima | 0.0 /100 | #338 | Tragic 69.0% |
| Immigrants | Yemen | 0.0 /100 | #339 | Tragic 68.9% |
| Menominee | 0.0 /100 | #340 | Tragic 68.7% |
| Tohono O'odham | 0.0 /100 | #341 | Tragic 68.6% |
| Immigrants | St. Vincent and the Grenadines | 0.0 /100 | #342 | Tragic 68.4% |
| Puerto Ricans | 0.0 /100 | #343 | Tragic 68.3% |
| Immigrants | Grenada | 0.0 /100 | #344 | Tragic 67.2% |
| Hopi | 0.0 /100 | #345 | Tragic 66.0% |
| Lumbee | 0.0 /100 | #346 | Tragic 65.5% |
| Navajo | 0.0 /100 | #347 | Tragic 64.8% |
Demographics Similar to Thais by In Labor Force | Age 20-24
In terms of in labor force | age 20-24, the demographic groups most similar to Thais are Immigrants from Senegal (74.0%, a difference of 0.010%), Immigrants from Syria (74.0%, a difference of 0.030%), Immigrants from Sri Lanka (74.0%, a difference of 0.040%), Immigrants from South Central Asia (74.0%, a difference of 0.040%), and Turkish (73.9%, a difference of 0.060%).
| Demographics | Rating | Rank | In Labor Force | Age 20-24 |
| Laotians | 3.5 /100 | #235 | Tragic 74.1% |
| Immigrants | France | 3.3 /100 | #236 | Tragic 74.1% |
| Bermudans | 3.2 /100 | #237 | Tragic 74.1% |
| Immigrants | Japan | 3.0 /100 | #238 | Tragic 74.1% |
| Immigrants | Latin America | 2.7 /100 | #239 | Tragic 74.1% |
| Immigrants | Sri Lanka | 2.3 /100 | #240 | Tragic 74.0% |
| Immigrants | Senegal | 2.1 /100 | #241 | Tragic 74.0% |
| Thais | 2.1 /100 | #242 | Tragic 74.0% |
| Immigrants | Syria | 1.9 /100 | #243 | Tragic 74.0% |
| Immigrants | South Central Asia | 1.9 /100 | #244 | Tragic 74.0% |
| Turks | 1.8 /100 | #245 | Tragic 73.9% |
| Immigrants | Panama | 1.6 /100 | #246 | Tragic 73.9% |
| Colville | 1.5 /100 | #247 | Tragic 73.9% |
| Immigrants | Saudi Arabia | 1.5 /100 | #248 | Tragic 73.9% |
| Blacks/African Americans | 1.3 /100 | #249 | Tragic 73.9% |