Puerto Rican vs Bhutanese In Labor Force | Age 20-24
COMPARE
Puerto Rican
Bhutanese
In Labor Force | Age 20-24
In Labor Force | Age 20-24 Comparison
Puerto Ricans
Bhutanese
68.3%
IN LABOR FORCE | AGE 20-24
0.0/ 100
METRIC RATING
343rd/ 347
METRIC RANK
75.4%
IN LABOR FORCE | AGE 20-24
80.8/ 100
METRIC RATING
144th/ 347
METRIC RANK
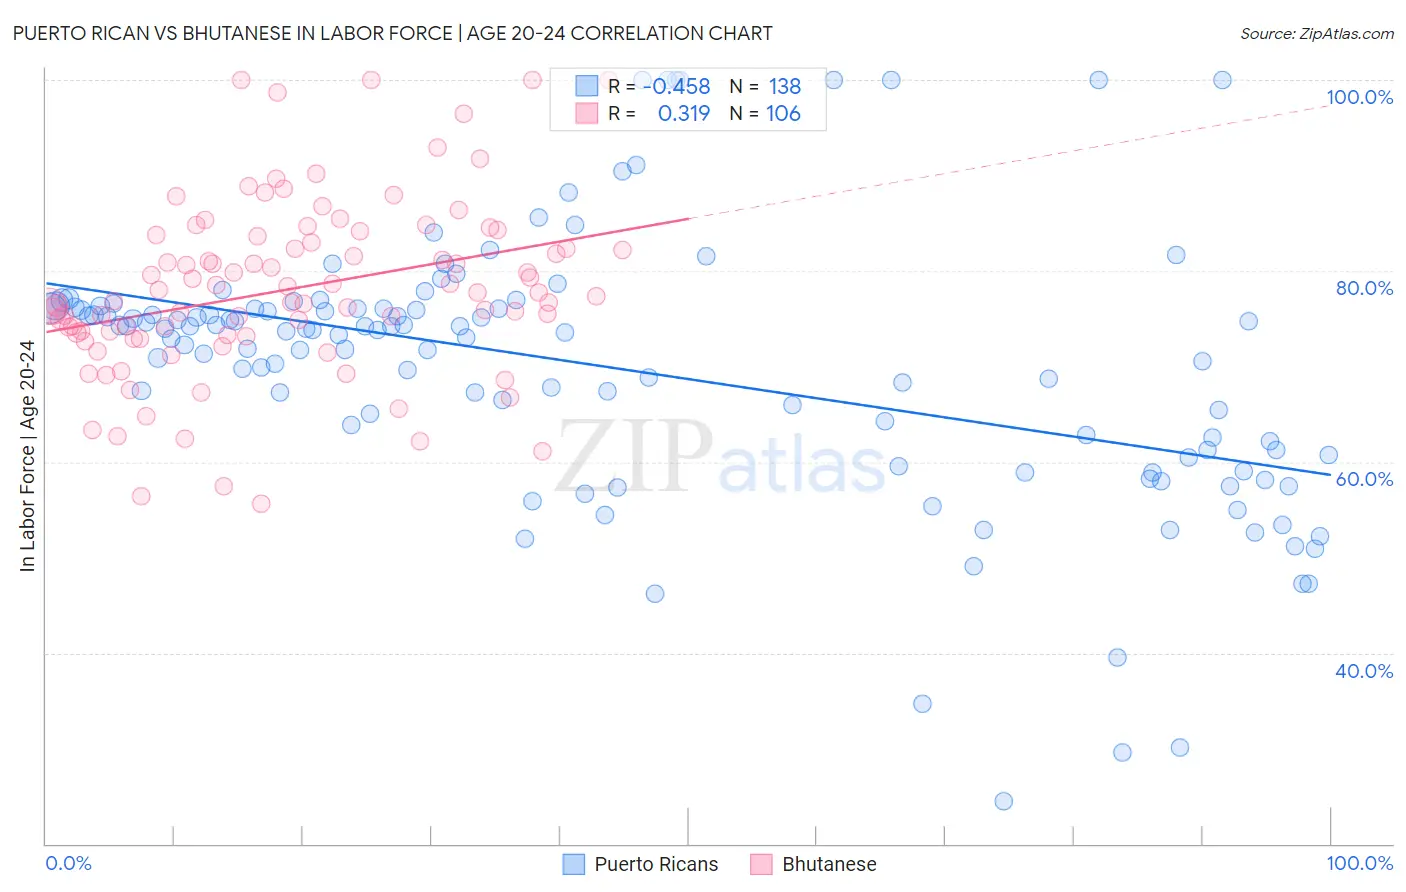
Puerto Rican vs Bhutanese In Labor Force | Age 20-24 Correlation Chart
The statistical analysis conducted on geographies consisting of 527,810,286 people shows a moderate negative correlation between the proportion of Puerto Ricans and labor force participation rate among population between the ages 20 and 24 in the United States with a correlation coefficient (R) of -0.458 and weighted average of 68.3%. Similarly, the statistical analysis conducted on geographies consisting of 455,273,075 people shows a mild positive correlation between the proportion of Bhutanese and labor force participation rate among population between the ages 20 and 24 in the United States with a correlation coefficient (R) of 0.319 and weighted average of 75.4%, a difference of 10.4%.
In Labor Force | Age 20-24 Correlation Summary
| Measurement | Puerto Rican | Bhutanese |
| Minimum | 24.4% | 55.6% |
| Maximum | 100.0% | 100.0% |
| Range | 75.6% | 44.4% |
| Mean | 69.9% | 78.1% |
| Median | 73.6% | 77.5% |
| Interquartile 25% (IQ1) | 61.2% | 73.3% |
| Interquartile 75% (IQ3) | 76.1% | 83.6% |
| Interquartile Range (IQR) | 14.9% | 10.3% |
| Standard Deviation (Sample) | 13.9% | 9.2% |
| Standard Deviation (Population) | 13.9% | 9.1% |
Similar Demographics by In Labor Force | Age 20-24
Demographics Similar to Puerto Ricans by In Labor Force | Age 20-24
In terms of in labor force | age 20-24, the demographic groups most similar to Puerto Ricans are Immigrants from St. Vincent and the Grenadines (68.4%, a difference of 0.12%), Tohono O'odham (68.6%, a difference of 0.43%), Menominee (68.7%, a difference of 0.56%), Immigrants from Yemen (68.9%, a difference of 0.87%), and Pima (69.0%, a difference of 1.0%).
| Demographics | Rating | Rank | In Labor Force | Age 20-24 |
| Yuman | 0.0 /100 | #333 | Tragic 70.3% |
| British West Indians | 0.0 /100 | #334 | Tragic 70.0% |
| Immigrants | Barbados | 0.0 /100 | #335 | Tragic 69.7% |
| Immigrants | Guyana | 0.0 /100 | #336 | Tragic 69.3% |
| Guyanese | 0.0 /100 | #337 | Tragic 69.2% |
| Pima | 0.0 /100 | #338 | Tragic 69.0% |
| Immigrants | Yemen | 0.0 /100 | #339 | Tragic 68.9% |
| Menominee | 0.0 /100 | #340 | Tragic 68.7% |
| Tohono O'odham | 0.0 /100 | #341 | Tragic 68.6% |
| Immigrants | St. Vincent and the Grenadines | 0.0 /100 | #342 | Tragic 68.4% |
| Puerto Ricans | 0.0 /100 | #343 | Tragic 68.3% |
| Immigrants | Grenada | 0.0 /100 | #344 | Tragic 67.2% |
| Hopi | 0.0 /100 | #345 | Tragic 66.0% |
| Lumbee | 0.0 /100 | #346 | Tragic 65.5% |
| Navajo | 0.0 /100 | #347 | Tragic 64.8% |
Demographics Similar to Bhutanese by In Labor Force | Age 20-24
In terms of in labor force | age 20-24, the demographic groups most similar to Bhutanese are Spaniard (75.5%, a difference of 0.030%), Korean (75.4%, a difference of 0.030%), Mexican American Indian (75.4%, a difference of 0.050%), Blackfeet (75.5%, a difference of 0.070%), and Comanche (75.4%, a difference of 0.070%).
| Demographics | Rating | Rank | In Labor Force | Age 20-24 |
| Jordanians | 84.8 /100 | #137 | Excellent 75.5% |
| Australians | 84.8 /100 | #138 | Excellent 75.5% |
| Immigrants | England | 84.6 /100 | #139 | Excellent 75.5% |
| Delaware | 84.5 /100 | #140 | Excellent 75.5% |
| Romanians | 84.1 /100 | #141 | Excellent 75.5% |
| Blackfeet | 83.6 /100 | #142 | Excellent 75.5% |
| Spaniards | 82.0 /100 | #143 | Excellent 75.5% |
| Bhutanese | 80.8 /100 | #144 | Excellent 75.4% |
| Koreans | 79.7 /100 | #145 | Good 75.4% |
| Mexican American Indians | 78.8 /100 | #146 | Good 75.4% |
| Comanche | 77.6 /100 | #147 | Good 75.4% |
| Immigrants | Cambodia | 76.7 /100 | #148 | Good 75.4% |
| Ugandans | 76.1 /100 | #149 | Good 75.4% |
| Salvadorans | 74.8 /100 | #150 | Good 75.3% |
| Paiute | 74.1 /100 | #151 | Good 75.3% |