Immigrants from El Salvador vs Thai In Labor Force | Age 20-24
COMPARE
Immigrants from El Salvador
Thai
In Labor Force | Age 20-24
In Labor Force | Age 20-24 Comparison
Immigrants from El Salvador
Thais
75.3%
IN LABOR FORCE | AGE 20-24
71.7/ 100
METRIC RATING
156th/ 347
METRIC RANK
74.0%
IN LABOR FORCE | AGE 20-24
2.1/ 100
METRIC RATING
242nd/ 347
METRIC RANK
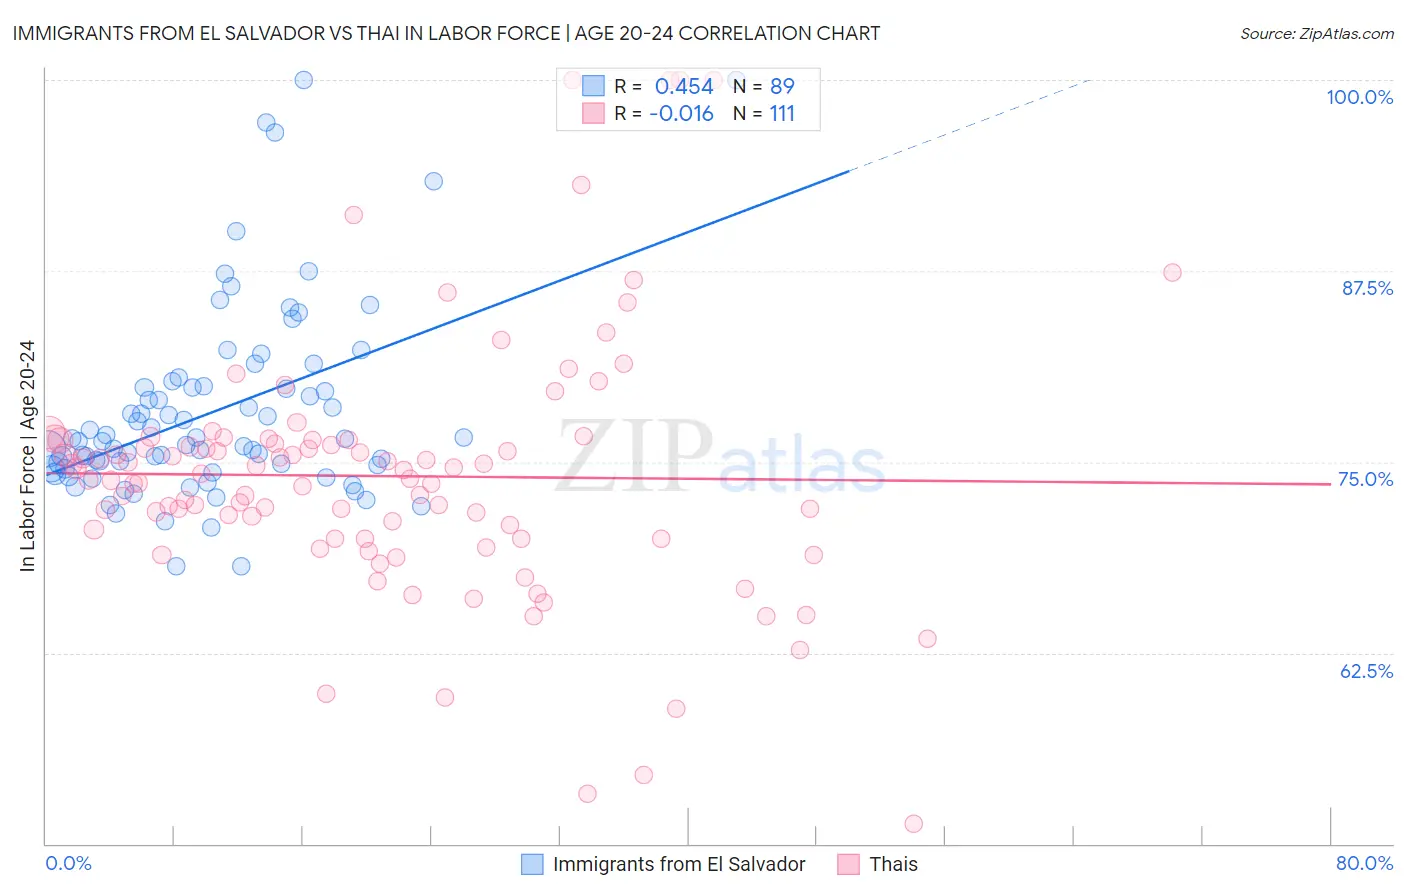
Immigrants from El Salvador vs Thai In Labor Force | Age 20-24 Correlation Chart
The statistical analysis conducted on geographies consisting of 357,704,995 people shows a moderate positive correlation between the proportion of Immigrants from El Salvador and labor force participation rate among population between the ages 20 and 24 in the United States with a correlation coefficient (R) of 0.454 and weighted average of 75.3%. Similarly, the statistical analysis conducted on geographies consisting of 475,671,796 people shows no correlation between the proportion of Thais and labor force participation rate among population between the ages 20 and 24 in the United States with a correlation coefficient (R) of -0.016 and weighted average of 74.0%, a difference of 1.8%.
In Labor Force | Age 20-24 Correlation Summary
| Measurement | Immigrants from El Salvador | Thai |
| Minimum | 68.1% | 51.3% |
| Maximum | 100.0% | 100.0% |
| Range | 31.9% | 48.7% |
| Mean | 78.3% | 74.1% |
| Median | 76.4% | 73.9% |
| Interquartile 25% (IQ1) | 74.5% | 70.0% |
| Interquartile 75% (IQ3) | 79.9% | 76.5% |
| Interquartile Range (IQR) | 5.4% | 6.5% |
| Standard Deviation (Sample) | 6.3% | 8.4% |
| Standard Deviation (Population) | 6.3% | 8.3% |
Similar Demographics by In Labor Force | Age 20-24
Demographics Similar to Immigrants from El Salvador by In Labor Force | Age 20-24
In terms of in labor force | age 20-24, the demographic groups most similar to Immigrants from El Salvador are Immigrants from Guatemala (75.3%, a difference of 0.0%), Immigrants from Western Europe (75.3%, a difference of 0.0%), Guatemalan (75.3%, a difference of 0.010%), Osage (75.3%, a difference of 0.010%), and Immigrants from Bolivia (75.3%, a difference of 0.010%).
| Demographics | Rating | Rank | In Labor Force | Age 20-24 |
| Ugandans | 76.1 /100 | #149 | Good 75.4% |
| Salvadorans | 74.8 /100 | #150 | Good 75.3% |
| Paiute | 74.1 /100 | #151 | Good 75.3% |
| Lebanese | 73.5 /100 | #152 | Good 75.3% |
| Guatemalans | 72.3 /100 | #153 | Good 75.3% |
| Osage | 72.3 /100 | #154 | Good 75.3% |
| Immigrants | Guatemala | 71.9 /100 | #155 | Good 75.3% |
| Immigrants | El Salvador | 71.7 /100 | #156 | Good 75.3% |
| Immigrants | Western Europe | 71.5 /100 | #157 | Good 75.3% |
| Immigrants | Bolivia | 71.0 /100 | #158 | Good 75.3% |
| South American Indians | 69.0 /100 | #159 | Good 75.3% |
| Japanese | 68.7 /100 | #160 | Good 75.3% |
| New Zealanders | 65.4 /100 | #161 | Good 75.2% |
| Immigrants | Romania | 64.6 /100 | #162 | Good 75.2% |
| Costa Ricans | 64.2 /100 | #163 | Good 75.2% |
Demographics Similar to Thais by In Labor Force | Age 20-24
In terms of in labor force | age 20-24, the demographic groups most similar to Thais are Immigrants from Senegal (74.0%, a difference of 0.010%), Immigrants from Syria (74.0%, a difference of 0.030%), Immigrants from Sri Lanka (74.0%, a difference of 0.040%), Immigrants from South Central Asia (74.0%, a difference of 0.040%), and Turkish (73.9%, a difference of 0.060%).
| Demographics | Rating | Rank | In Labor Force | Age 20-24 |
| Laotians | 3.5 /100 | #235 | Tragic 74.1% |
| Immigrants | France | 3.3 /100 | #236 | Tragic 74.1% |
| Bermudans | 3.2 /100 | #237 | Tragic 74.1% |
| Immigrants | Japan | 3.0 /100 | #238 | Tragic 74.1% |
| Immigrants | Latin America | 2.7 /100 | #239 | Tragic 74.1% |
| Immigrants | Sri Lanka | 2.3 /100 | #240 | Tragic 74.0% |
| Immigrants | Senegal | 2.1 /100 | #241 | Tragic 74.0% |
| Thais | 2.1 /100 | #242 | Tragic 74.0% |
| Immigrants | Syria | 1.9 /100 | #243 | Tragic 74.0% |
| Immigrants | South Central Asia | 1.9 /100 | #244 | Tragic 74.0% |
| Turks | 1.8 /100 | #245 | Tragic 73.9% |
| Immigrants | Panama | 1.6 /100 | #246 | Tragic 73.9% |
| Colville | 1.5 /100 | #247 | Tragic 73.9% |
| Immigrants | Saudi Arabia | 1.5 /100 | #248 | Tragic 73.9% |
| Blacks/African Americans | 1.3 /100 | #249 | Tragic 73.9% |