Peruvian vs Armenian In Labor Force | Age 30-34
COMPARE
Peruvian
Armenian
In Labor Force | Age 30-34
In Labor Force | Age 30-34 Comparison
Peruvians
Armenians
84.8%
IN LABOR FORCE | AGE 30-34
65.9/ 100
METRIC RATING
157th/ 347
METRIC RANK
85.0%
IN LABOR FORCE | AGE 30-34
92.2/ 100
METRIC RATING
123rd/ 347
METRIC RANK
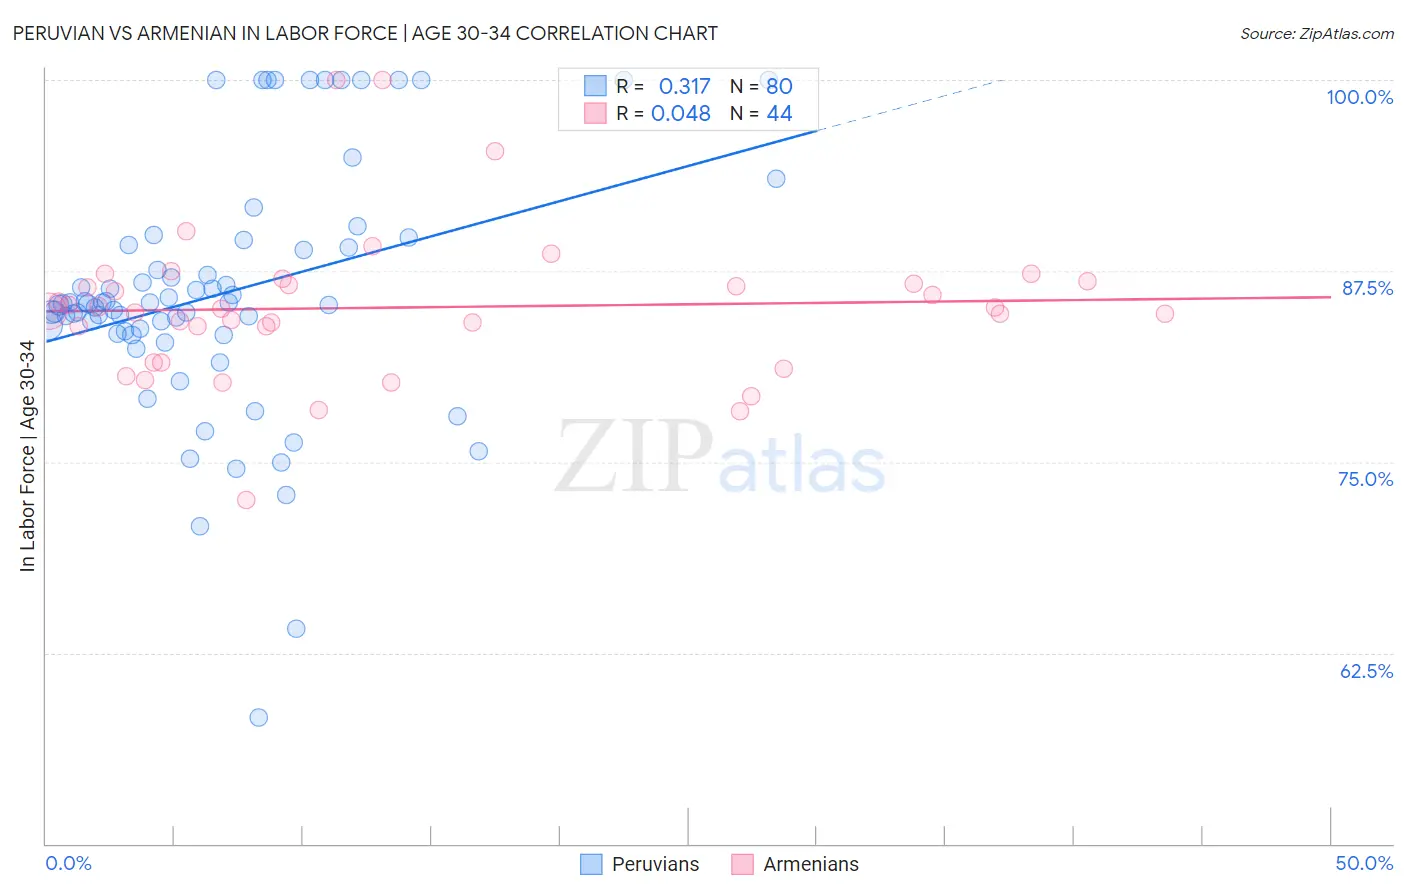
Peruvian vs Armenian In Labor Force | Age 30-34 Correlation Chart
The statistical analysis conducted on geographies consisting of 363,011,511 people shows a mild positive correlation between the proportion of Peruvians and labor force participation rate among population between the ages 30 and 34 in the United States with a correlation coefficient (R) of 0.317 and weighted average of 84.8%. Similarly, the statistical analysis conducted on geographies consisting of 310,746,889 people shows no correlation between the proportion of Armenians and labor force participation rate among population between the ages 30 and 34 in the United States with a correlation coefficient (R) of 0.048 and weighted average of 85.0%, a difference of 0.32%.
In Labor Force | Age 30-34 Correlation Summary
| Measurement | Peruvian | Armenian |
| Minimum | 58.3% | 72.5% |
| Maximum | 100.0% | 100.0% |
| Range | 41.7% | 27.5% |
| Mean | 86.0% | 85.1% |
| Median | 85.3% | 84.9% |
| Interquartile 25% (IQ1) | 83.5% | 82.7% |
| Interquartile 75% (IQ3) | 89.1% | 86.8% |
| Interquartile Range (IQR) | 5.6% | 4.1% |
| Standard Deviation (Sample) | 8.1% | 5.0% |
| Standard Deviation (Population) | 8.1% | 4.9% |
Similar Demographics by In Labor Force | Age 30-34
Demographics Similar to Peruvians by In Labor Force | Age 30-34
In terms of in labor force | age 30-34, the demographic groups most similar to Peruvians are French Canadian (84.8%, a difference of 0.010%), Immigrants from Armenia (84.8%, a difference of 0.010%), Czechoslovakian (84.8%, a difference of 0.020%), Syrian (84.8%, a difference of 0.030%), and Northern European (84.8%, a difference of 0.030%).
| Demographics | Rating | Rank | In Labor Force | Age 30-34 |
| Germans | 75.1 /100 | #150 | Good 84.8% |
| Immigrants | Senegal | 74.0 /100 | #151 | Good 84.8% |
| Romanians | 73.5 /100 | #152 | Good 84.8% |
| Syrians | 70.1 /100 | #153 | Good 84.8% |
| Northern Europeans | 70.0 /100 | #154 | Good 84.8% |
| Immigrants | Sudan | 69.5 /100 | #155 | Good 84.8% |
| French Canadians | 67.3 /100 | #156 | Good 84.8% |
| Peruvians | 65.9 /100 | #157 | Good 84.8% |
| Immigrants | Armenia | 64.7 /100 | #158 | Good 84.8% |
| Czechoslovakians | 63.0 /100 | #159 | Good 84.8% |
| Pakistanis | 60.8 /100 | #160 | Good 84.7% |
| Immigrants | Cambodia | 60.7 /100 | #161 | Good 84.7% |
| South Americans | 58.7 /100 | #162 | Average 84.7% |
| Immigrants | Uruguay | 57.4 /100 | #163 | Average 84.7% |
| Icelanders | 56.8 /100 | #164 | Average 84.7% |
Demographics Similar to Armenians by In Labor Force | Age 30-34
In terms of in labor force | age 30-34, the demographic groups most similar to Armenians are Australian (85.0%, a difference of 0.0%), Immigrants from Kuwait (85.1%, a difference of 0.010%), Immigrants from Jordan (85.0%, a difference of 0.020%), Asian (85.1%, a difference of 0.030%), and Immigrants from Southern Europe (85.1%, a difference of 0.030%).
| Demographics | Rating | Rank | In Labor Force | Age 30-34 |
| Egyptians | 94.5 /100 | #116 | Exceptional 85.1% |
| Immigrants | Denmark | 94.3 /100 | #117 | Exceptional 85.1% |
| Immigrants | Malaysia | 94.2 /100 | #118 | Exceptional 85.1% |
| Asians | 93.4 /100 | #119 | Exceptional 85.1% |
| Immigrants | Southern Europe | 93.3 /100 | #120 | Exceptional 85.1% |
| Immigrants | Egypt | 93.2 /100 | #121 | Exceptional 85.1% |
| Immigrants | Kuwait | 92.6 /100 | #122 | Exceptional 85.1% |
| Armenians | 92.2 /100 | #123 | Exceptional 85.0% |
| Australians | 92.0 /100 | #124 | Exceptional 85.0% |
| Immigrants | Jordan | 91.5 /100 | #125 | Exceptional 85.0% |
| Austrians | 90.9 /100 | #126 | Exceptional 85.0% |
| Slavs | 90.7 /100 | #127 | Exceptional 85.0% |
| Immigrants | Argentina | 90.6 /100 | #128 | Exceptional 85.0% |
| Immigrants | Western Africa | 90.2 /100 | #129 | Exceptional 85.0% |
| Immigrants | Spain | 90.0 /100 | #130 | Exceptional 85.0% |