Peruvian vs Immigrants from Portugal In Labor Force | Age 30-34

COMPARE

Peruvian
Race
Ancestry
AfghanAfricanAlaska NativeAlaskan AthabascanAlbanianAleutAlsatianAmericanApacheArabArapahoArgentineanArmenianAssyrian/Chaldean/SyriacAustralianAustrianBahamianBangladeshiBarbadianBasqueBelgianBelizeanBermudanBhutaneseBlackfeetBolivianBrazilianBritishBritish West IndianBulgarianBurmeseCajunCambodianCanadianCape VerdeanCarpatho RusynCelticCentral AmericanCentral American IndianCherokeeCheyenneChickasawChileanChineseChippewaChoctawColombianColvilleComancheCosta RicanCreeCreekCroatianCrowCubanCypriotCzechCzechoslovakianDanishDelawareDominicanDutchDutch West IndianEastern EuropeanEcuadorianEgyptianEnglishEstonianEthiopianEuropeanFijianFilipinoFinnishFrenchFrench American IndianFrench CanadianGermanGerman RussianGhanaianGreekGuamanian/ChamorroGuatemalanGuyaneseHaitianHmongHonduranHopiHoumaHungarianIcelanderIndian (Asian)IndonesianInupiatIranianIraqiIrishIroquoisIsraeliItalianJamaicanJapaneseJordanianKenyanKiowaKoreanLaotianLatvianLebaneseLiberianLithuanianLumbeeLuxembourgerMacedonianMalaysianMalteseMarshalleseMenomineeMexicanMexican American IndianMongolianMoroccanNative HawaiianNavajoNepaleseNew ZealanderNicaraguanNigerianNorthern EuropeanNorwegianOkinawanOsageOttawaPaiutePakistaniPalestinianPanamanianParaguayanPennsylvania GermanPeruvianPimaPolishPortuguesePotawatomiPuebloPuerto RicanPuget Sound SalishRomanianRussianSalvadoranSamoanScandinavianScotch-IrishScottishSeminoleSenegaleseSerbianShoshoneSierra LeoneanSiouxSlavicSlovakSloveneSomaliSouth AfricanSouth AmericanSouth American IndianSoviet UnionSpaniardSpanishSpanish AmericanSpanish American IndianSri LankanSubsaharan AfricanSudaneseSwedishSwissSyrianTaiwaneseThaiTlingit-HaidaTohono O'OdhamTonganTrinidadian and TobagonianTsimshianTurkishU.S. Virgin IslanderUgandanUkrainianUruguayanUteVenezuelanVietnameseWelshWest IndianYakamaYaquiYugoslavianYumanYup'ikZimbabwean
Immigration
NonimmigrantsImmigrantsAfghanistanAfricaAlbaniaArgentinaArmeniaAsiaAustraliaAustriaBahamasBangladeshBarbadosBelarusBelgiumBelizeBoliviaBosnia and HerzegovinaBrazilBulgariaBurma/MyanmarCabo VerdeCambodiaCameroonCanadaCaribbeanCentral AmericaChileChinaColombiaCongoCosta RicaCroatiaCubaCzechoslovakiaDenmarkDominicaDominican RepublicEastern AfricaEastern AsiaEastern EuropeEcuadorEgyptEl SalvadorEnglandEritreaEthiopiaEuropeFijiFranceGermanyGhanaGreeceGrenadaGuatemalaGuyanaHaitiHondurasHong KongHungaryIndiaIndonesiaIranIraqIrelandIsraelItalyJamaicaJapanJordanKazakhstanKenyaKoreaKuwaitLaosLatin AmericaLatviaLebanonLiberiaLithuaniaMalaysiaMexicoMicronesiaMiddle AfricaMoldovaMoroccoNepalNetherlandsNicaraguaNigeriaNorth AmericaNorth MacedoniaNorthern AfricaNorthern EuropeNorwayOceaniaPakistanPanamaPeruPhilippinesPolandRomaniaRussiaSaudi ArabiaScotlandSenegalSerbiaSierra LeoneSingaporeSomaliaSouth AfricaSouth AmericaSouth Central AsiaSouth Eastern AsiaSouthern EuropeSpainSri LankaSt. Vincent and the GrenadinesSudanSwedenSwitzerlandSyriaTaiwanThailandTrinidad and TobagoTurkeyUgandaUkraineUruguayUzbekistanVenezuelaVietnamWest IndiesWestern AfricaWestern AsiaWestern EuropeYemenZaireZimbabweAzores
Immigrants from Portugal
Race
Ancestry
AfghanAfricanAlaska NativeAlaskan AthabascanAlbanianAleutAlsatianAmericanApacheArabArapahoArgentineanArmenianAssyrian/Chaldean/SyriacAustralianAustrianBahamianBangladeshiBarbadianBasqueBelgianBelizeanBermudanBhutaneseBlackfeetBolivianBrazilianBritishBritish West IndianBulgarianBurmeseCajunCambodianCanadianCape VerdeanCarpatho RusynCelticCentral AmericanCentral American IndianCherokeeCheyenneChickasawChileanChineseChippewaChoctawColombianColvilleComancheCosta RicanCreeCreekCroatianCrowCubanCypriotCzechCzechoslovakianDanishDelawareDominicanDutchDutch West IndianEastern EuropeanEcuadorianEgyptianEnglishEstonianEthiopianEuropeanFijianFilipinoFinnishFrenchFrench American IndianFrench CanadianGermanGerman RussianGhanaianGreekGuamanian/ChamorroGuatemalanGuyaneseHaitianHmongHonduranHopiHoumaHungarianIcelanderIndian (Asian)IndonesianInupiatIranianIraqiIrishIroquoisIsraeliItalianJamaicanJapaneseJordanianKenyanKiowaKoreanLaotianLatvianLebaneseLiberianLithuanianLumbeeLuxembourgerMacedonianMalaysianMalteseMarshalleseMenomineeMexicanMexican American IndianMongolianMoroccanNative HawaiianNavajoNepaleseNew ZealanderNicaraguanNigerianNorthern EuropeanNorwegianOkinawanOsageOttawaPaiutePakistaniPalestinianPanamanianParaguayanPennsylvania GermanPimaPolishPortuguesePotawatomiPuebloPuerto RicanPuget Sound SalishRomanianRussianSalvadoranSamoanScandinavianScotch-IrishScottishSeminoleSenegaleseSerbianShoshoneSierra LeoneanSiouxSlavicSlovakSloveneSomaliSouth AfricanSouth AmericanSouth American IndianSoviet UnionSpaniardSpanishSpanish AmericanSpanish American IndianSri LankanSubsaharan AfricanSudaneseSwedishSwissSyrianTaiwaneseThaiTlingit-HaidaTohono O'OdhamTonganTrinidadian and TobagonianTsimshianTurkishU.S. Virgin IslanderUgandanUkrainianUruguayanUteVenezuelanVietnameseWelshWest IndianYakamaYaquiYugoslavianYumanYup'ikZimbabwean
Immigration
NonimmigrantsImmigrantsAfghanistanAfricaAlbaniaArgentinaArmeniaAsiaAustraliaAustriaBahamasBangladeshBarbadosBelarusBelgiumBelizeBoliviaBosnia and HerzegovinaBrazilBulgariaBurma/MyanmarCabo VerdeCambodiaCameroonCanadaCaribbeanCentral AmericaChileChinaColombiaCongoCosta RicaCroatiaCubaCzechoslovakiaDenmarkDominicaDominican RepublicEastern AfricaEastern AsiaEastern EuropeEcuadorEgyptEl SalvadorEnglandEritreaEthiopiaEuropeFijiFranceGermanyGhanaGreeceGrenadaGuatemalaGuyanaHaitiHondurasHong KongHungaryIndiaIndonesiaIranIraqIrelandIsraelItalyJamaicaJapanJordanKazakhstanKenyaKoreaKuwaitLaosLatin AmericaLatviaLebanonLiberiaLithuaniaMalaysiaMexicoMicronesiaMiddle AfricaMoldovaMoroccoNepalNetherlandsNicaraguaNigeriaNorth AmericaNorth MacedoniaNorthern AfricaNorthern EuropeNorwayOceaniaPakistanPanamaPeruPhilippinesPolandPortugalRomaniaRussiaSaudi ArabiaScotlandSenegalSerbiaSierra LeoneSingaporeSomaliaSouth AfricaSouth AmericaSouth Central AsiaSouth Eastern AsiaSouthern EuropeSpainSri LankaSt. Vincent and the GrenadinesSudanSwedenSwitzerlandSyriaTaiwanThailandTrinidad and TobagoTurkeyUgandaUkraineUruguayUzbekistanVenezuelaVietnamWest IndiesWestern AfricaWestern AsiaWestern EuropeYemenZaireZimbabweAzores
In Labor Force | Age 30-34
Income
Poverty
Unemployment
Labor Participation
Family Structure
Vehicle Availability
Education Level
Disability

In Labor Force | Age 30-34 Comparison

Peruvians

Immigrants from Portugal

Good
Tragic
84.8%
IN LABOR FORCE | AGE 30-34
65.9/ 100
METRIC RATING
157th/ 347
METRIC RANK
84.0%
IN LABOR FORCE | AGE 30-34
1.2/ 100
METRIC RATING
241st/ 347
METRIC RANK

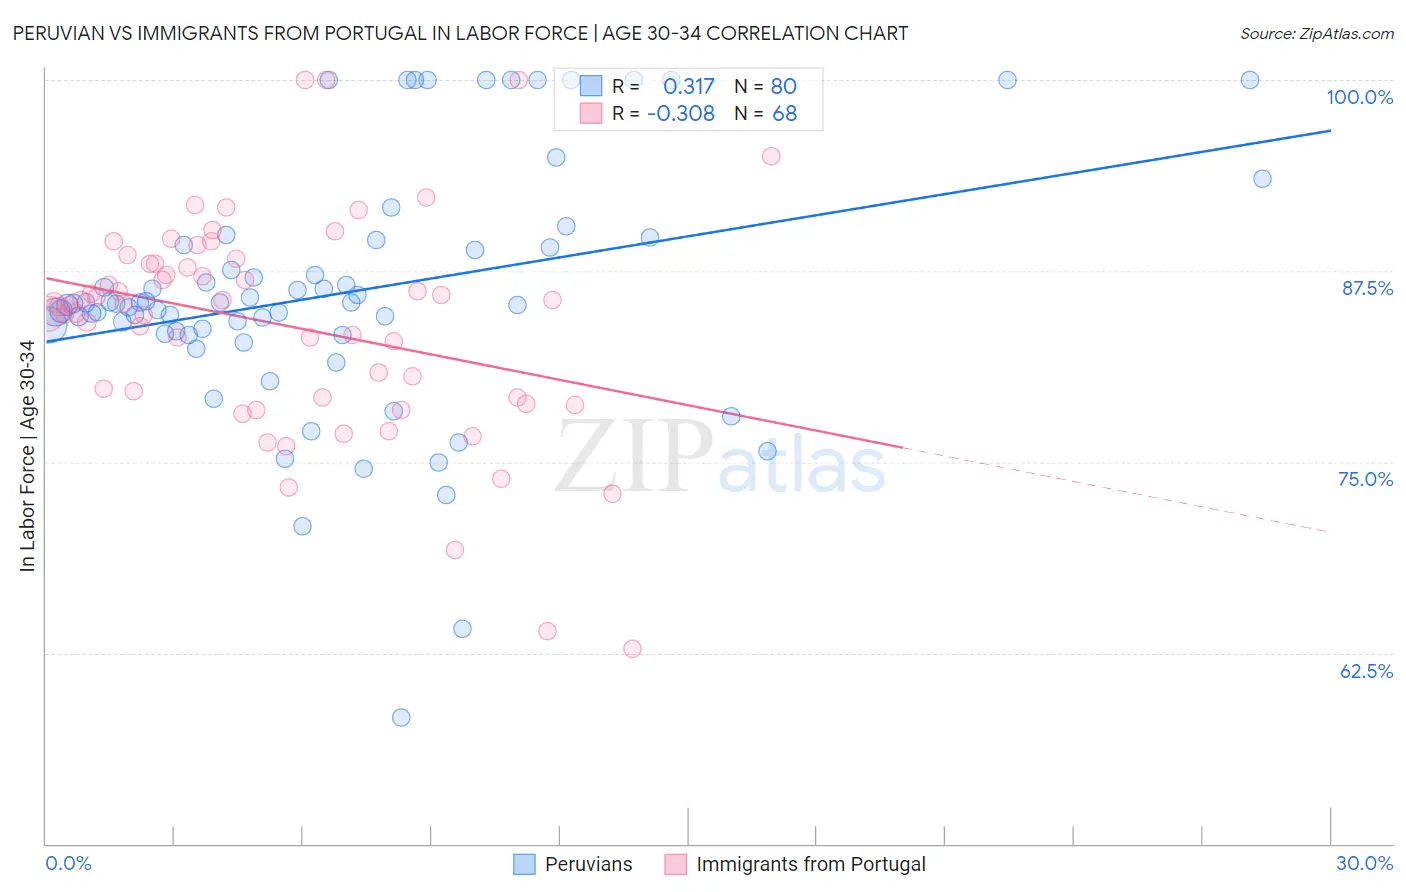
Peruvian vs Immigrants from Portugal In Labor Force | Age 30-34 Correlation Chart

The statistical analysis conducted on geographies consisting of 363,011,511 people shows a mild positive correlation between the proportion of Peruvians and labor force participation rate among population between the ages 30 and 34 in the United States with a correlation coefficient (R) of 0.317 and weighted average of 84.8%. Similarly, the statistical analysis conducted on geographies consisting of 174,756,515 people shows a mild negative correlation between the proportion of Immigrants from Portugal and labor force participation rate among population between the ages 30 and 34 in the United States with a correlation coefficient (R) of -0.308 and weighted average of 84.0%, a difference of 0.90%.
Peruvian vs Immigrants from Portugal In Labor Force | Age 30-34

In Labor Force | Age 30-34 Correlation Summary

MeasurementPeruvianImmigrants from Portugal
Minimum58.3%62.8%
Maximum100.0%100.0%
Range41.7%37.2%
Mean86.0%84.0%
Median85.3%85.3%
Interquartile 25% (IQ1)83.5%79.2%
Interquartile 75% (IQ3)89.1%88.0%
Interquartile Range (IQR)5.6%8.8%
Standard Deviation (Sample)8.1%7.2%
Standard Deviation (Population)8.1%7.1%

Similar Demographics by In Labor Force | Age 30-34

Demographics Similar to Peruvians by In Labor Force | Age 30-34

In terms of in labor force | age 30-34, the demographic groups most similar to Peruvians are French Canadian (84.8%, a difference of 0.010%), Immigrants from Armenia (84.8%, a difference of 0.010%), Czechoslovakian (84.8%, a difference of 0.020%), Syrian (84.8%, a difference of 0.030%), and Northern European (84.8%, a difference of 0.030%).
DemographicsRating | RankIn Labor Force | Age 30-34
Germans
75.1
/100
|
#150
Good
84.8%
Immigrants | Senegal
74.0
/100
|
#151
Good
84.8%
Romanians
73.5
/100
|
#152
Good
84.8%
Syrians
70.1
/100
|
#153
Good
84.8%
Northern Europeans
70.0
/100
|
#154
Good
84.8%
Immigrants | Sudan
69.5
/100
|
#155
Good
84.8%
French Canadians
67.3
/100
|
#156
Good
84.8%
Peruvians
65.9
/100
|
#157
Good
84.8%
Immigrants | Armenia
64.7
/100
|
#158
Good
84.8%
Czechoslovakians
63.0
/100
|
#159
Good
84.8%
Pakistanis
60.8
/100
|
#160
Good
84.7%
Immigrants | Cambodia
60.7
/100
|
#161
Good
84.7%
South Americans
58.7
/100
|
#162
Average
84.7%
Immigrants | Uruguay
57.4
/100
|
#163
Average
84.7%
Icelanders
56.8
/100
|
#164
Average
84.7%

Demographics Similar to Immigrants from Portugal by In Labor Force | Age 30-34

In terms of in labor force | age 30-34, the demographic groups most similar to Immigrants from Portugal are Immigrants from Oceania (84.0%, a difference of 0.010%), English (84.0%, a difference of 0.020%), Venezuelan (84.0%, a difference of 0.020%), Immigrants from Caribbean (84.0%, a difference of 0.020%), and Celtic (84.1%, a difference of 0.030%).
DemographicsRating | RankIn Labor Force | Age 30-34
Haitians
1.8
/100
|
#234
Tragic
84.1%
French American Indians
1.7
/100
|
#235
Tragic
84.1%
U.S. Virgin Islanders
1.5
/100
|
#236
Tragic
84.1%
Celtics
1.4
/100
|
#237
Tragic
84.1%
Immigrants | Barbados
1.4
/100
|
#238
Tragic
84.0%
English
1.4
/100
|
#239
Tragic
84.0%
Venezuelans
1.3
/100
|
#240
Tragic
84.0%
Immigrants | Portugal
1.2
/100
|
#241
Tragic
84.0%
Immigrants | Oceania
1.1
/100
|
#242
Tragic
84.0%
Immigrants | Caribbean
1.1
/100
|
#243
Tragic
84.0%
Basques
0.9
/100
|
#244
Tragic
84.0%
Immigrants | Venezuela
0.9
/100
|
#245
Tragic
84.0%
Central Americans
0.9
/100
|
#246
Tragic
84.0%
British West Indians
0.8
/100
|
#247
Tragic
84.0%
Portuguese
0.8
/100
|
#248
Tragic
84.0%