Immigrants from Taiwan vs Armenian In Labor Force | Age 30-34

COMPARE

Immigrants from Taiwan
Race
Ancestry
AfghanAfricanAlaska NativeAlaskan AthabascanAlbanianAleutAlsatianAmericanApacheArabArapahoArgentineanAssyrian/Chaldean/SyriacAustralianAustrianBahamianBangladeshiBarbadianBasqueBelgianBelizeanBermudanBhutaneseBlackfeetBolivianBrazilianBritishBritish West IndianBulgarianBurmeseCajunCambodianCanadianCape VerdeanCarpatho RusynCelticCentral AmericanCentral American IndianCherokeeCheyenneChickasawChileanChineseChippewaChoctawColombianColvilleComancheCosta RicanCreeCreekCroatianCrowCubanCypriotCzechCzechoslovakianDanishDelawareDominicanDutchDutch West IndianEastern EuropeanEcuadorianEgyptianEnglishEstonianEthiopianEuropeanFijianFilipinoFinnishFrenchFrench American IndianFrench CanadianGermanGerman RussianGhanaianGreekGuamanian/ChamorroGuatemalanGuyaneseHaitianHmongHonduranHopiHoumaHungarianIcelanderIndian (Asian)IndonesianInupiatIranianIraqiIrishIroquoisIsraeliItalianJamaicanJapaneseJordanianKenyanKiowaKoreanLaotianLatvianLebaneseLiberianLithuanianLumbeeLuxembourgerMacedonianMalaysianMalteseMarshalleseMenomineeMexicanMexican American IndianMongolianMoroccanNative HawaiianNavajoNepaleseNew ZealanderNicaraguanNigerianNorthern EuropeanNorwegianOkinawanOsageOttawaPaiutePakistaniPalestinianPanamanianParaguayanPennsylvania GermanPeruvianPimaPolishPortuguesePotawatomiPuebloPuerto RicanPuget Sound SalishRomanianRussianSalvadoranSamoanScandinavianScotch-IrishScottishSeminoleSenegaleseSerbianShoshoneSierra LeoneanSiouxSlavicSlovakSloveneSomaliSouth AfricanSouth AmericanSouth American IndianSoviet UnionSpaniardSpanishSpanish AmericanSpanish American IndianSri LankanSubsaharan AfricanSudaneseSwedishSwissSyrianTaiwaneseThaiTlingit-HaidaTohono O'OdhamTonganTrinidadian and TobagonianTsimshianTurkishU.S. Virgin IslanderUgandanUkrainianUruguayanUteVenezuelanVietnameseWelshWest IndianYakamaYaquiYugoslavianYumanYup'ikZimbabwean
Immigration
NonimmigrantsImmigrantsAfghanistanAfricaAlbaniaArgentinaArmeniaAsiaAustraliaAustriaBahamasBangladeshBarbadosBelarusBelgiumBelizeBoliviaBosnia and HerzegovinaBrazilBulgariaBurma/MyanmarCabo VerdeCambodiaCameroonCanadaCaribbeanCentral AmericaChileChinaColombiaCongoCosta RicaCroatiaCubaCzechoslovakiaDenmarkDominicaDominican RepublicEastern AfricaEastern AsiaEastern EuropeEcuadorEgyptEl SalvadorEnglandEritreaEthiopiaEuropeFijiFranceGermanyGhanaGreeceGrenadaGuatemalaGuyanaHaitiHondurasHong KongHungaryIndiaIndonesiaIranIraqIrelandIsraelItalyJamaicaJapanJordanKazakhstanKenyaKoreaKuwaitLaosLatin AmericaLatviaLebanonLiberiaLithuaniaMalaysiaMexicoMicronesiaMiddle AfricaMoldovaMoroccoNepalNetherlandsNicaraguaNigeriaNorth AmericaNorth MacedoniaNorthern AfricaNorthern EuropeNorwayOceaniaPakistanPanamaPeruPhilippinesPolandPortugalRomaniaRussiaSaudi ArabiaScotlandSenegalSerbiaSierra LeoneSingaporeSomaliaSouth AfricaSouth AmericaSouth Central AsiaSouth Eastern AsiaSouthern EuropeSpainSri LankaSt. Vincent and the GrenadinesSudanSwedenSwitzerlandSyriaTaiwanThailandTrinidad and TobagoTurkeyUgandaUkraineUruguayUzbekistanVenezuelaVietnamWest IndiesWestern AfricaWestern AsiaWestern EuropeYemenZaireZimbabweAzores
Armenian
Race
Ancestry
AfghanAfricanAlaska NativeAlaskan AthabascanAlbanianAleutAlsatianAmericanApacheArabArapahoArgentineanArmenianAssyrian/Chaldean/SyriacAustralianAustrianBahamianBangladeshiBarbadianBasqueBelgianBelizeanBermudanBhutaneseBlackfeetBolivianBrazilianBritishBritish West IndianBulgarianBurmeseCajunCambodianCanadianCape VerdeanCarpatho RusynCelticCentral AmericanCentral American IndianCherokeeCheyenneChickasawChileanChineseChippewaChoctawColombianColvilleComancheCosta RicanCreeCreekCroatianCrowCubanCypriotCzechCzechoslovakianDanishDelawareDominicanDutchDutch West IndianEastern EuropeanEcuadorianEgyptianEnglishEstonianEthiopianEuropeanFijianFilipinoFinnishFrenchFrench American IndianFrench CanadianGermanGerman RussianGhanaianGreekGuamanian/ChamorroGuatemalanGuyaneseHaitianHmongHonduranHopiHoumaHungarianIcelanderIndian (Asian)IndonesianInupiatIranianIraqiIrishIroquoisIsraeliItalianJamaicanJapaneseJordanianKenyanKiowaKoreanLaotianLatvianLebaneseLiberianLithuanianLumbeeLuxembourgerMacedonianMalaysianMalteseMarshalleseMenomineeMexicanMexican American IndianMongolianMoroccanNative HawaiianNavajoNepaleseNew ZealanderNicaraguanNigerianNorthern EuropeanNorwegianOkinawanOsageOttawaPaiutePakistaniPalestinianPanamanianParaguayanPennsylvania GermanPeruvianPimaPolishPortuguesePotawatomiPuebloPuerto RicanPuget Sound SalishRomanianRussianSalvadoranSamoanScandinavianScotch-IrishScottishSeminoleSenegaleseSerbianShoshoneSierra LeoneanSiouxSlavicSlovakSloveneSomaliSouth AfricanSouth AmericanSouth American IndianSoviet UnionSpaniardSpanishSpanish AmericanSpanish American IndianSri LankanSubsaharan AfricanSudaneseSwedishSwissSyrianTaiwaneseThaiTlingit-HaidaTohono O'OdhamTonganTrinidadian and TobagonianTsimshianTurkishU.S. Virgin IslanderUgandanUkrainianUruguayanUteVenezuelanVietnameseWelshWest IndianYakamaYaquiYugoslavianYumanYup'ikZimbabwean
Immigration
NonimmigrantsImmigrantsAfghanistanAfricaAlbaniaArgentinaArmeniaAsiaAustraliaAustriaBahamasBangladeshBarbadosBelarusBelgiumBelizeBoliviaBosnia and HerzegovinaBrazilBulgariaBurma/MyanmarCabo VerdeCambodiaCameroonCanadaCaribbeanCentral AmericaChileChinaColombiaCongoCosta RicaCroatiaCubaCzechoslovakiaDenmarkDominicaDominican RepublicEastern AfricaEastern AsiaEastern EuropeEcuadorEgyptEl SalvadorEnglandEritreaEthiopiaEuropeFijiFranceGermanyGhanaGreeceGrenadaGuatemalaGuyanaHaitiHondurasHong KongHungaryIndiaIndonesiaIranIraqIrelandIsraelItalyJamaicaJapanJordanKazakhstanKenyaKoreaKuwaitLaosLatin AmericaLatviaLebanonLiberiaLithuaniaMalaysiaMexicoMicronesiaMiddle AfricaMoldovaMoroccoNepalNetherlandsNicaraguaNigeriaNorth AmericaNorth MacedoniaNorthern AfricaNorthern EuropeNorwayOceaniaPakistanPanamaPeruPhilippinesPolandPortugalRomaniaRussiaSaudi ArabiaScotlandSenegalSerbiaSierra LeoneSingaporeSomaliaSouth AfricaSouth AmericaSouth Central AsiaSouth Eastern AsiaSouthern EuropeSpainSri LankaSt. Vincent and the GrenadinesSudanSwedenSwitzerlandSyriaThailandTrinidad and TobagoTurkeyUgandaUkraineUruguayUzbekistanVenezuelaVietnamWest IndiesWestern AfricaWestern AsiaWestern EuropeYemenZaireZimbabweAzores
In Labor Force | Age 30-34
Income
Poverty
Unemployment
Labor Participation
Family Structure
Vehicle Availability
Education Level
Disability

In Labor Force | Age 30-34 Comparison

Immigrants from Taiwan

Armenians

Exceptional
Exceptional
85.3%
IN LABOR FORCE | AGE 30-34
98.3/ 100
METRIC RATING
86th/ 347
METRIC RANK
85.0%
IN LABOR FORCE | AGE 30-34
92.2/ 100
METRIC RATING
123rd/ 347
METRIC RANK

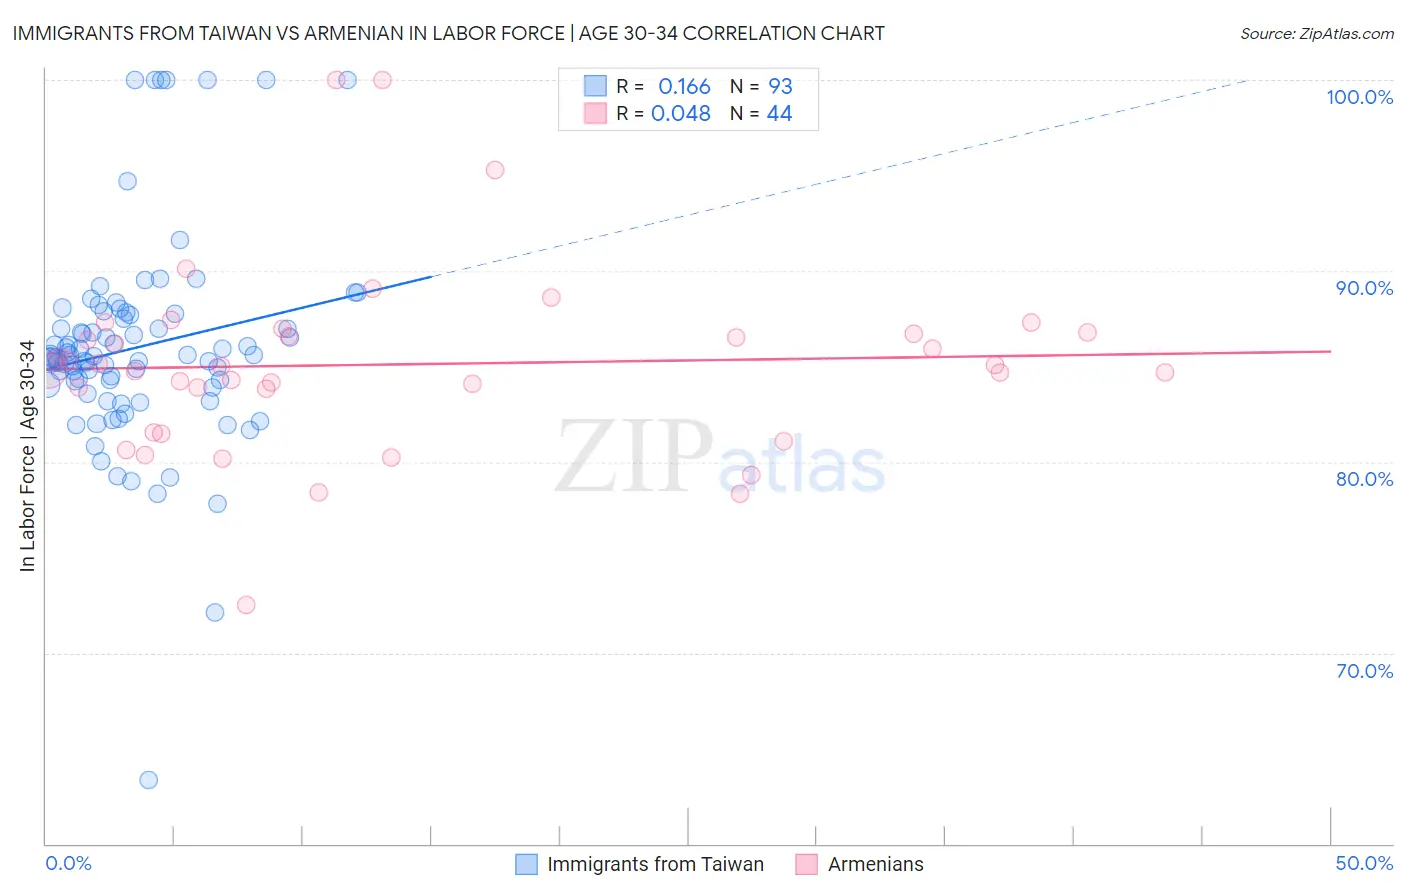
Immigrants from Taiwan vs Armenian In Labor Force | Age 30-34 Correlation Chart

The statistical analysis conducted on geographies consisting of 298,154,729 people shows a poor positive correlation between the proportion of Immigrants from Taiwan and labor force participation rate among population between the ages 30 and 34 in the United States with a correlation coefficient (R) of 0.166 and weighted average of 85.3%. Similarly, the statistical analysis conducted on geographies consisting of 310,746,889 people shows no correlation between the proportion of Armenians and labor force participation rate among population between the ages 30 and 34 in the United States with a correlation coefficient (R) of 0.048 and weighted average of 85.0%, a difference of 0.28%.
Immigrants from Taiwan vs Armenian In Labor Force | Age 30-34

In Labor Force | Age 30-34 Correlation Summary

MeasurementImmigrants from TaiwanArmenian
Minimum63.4%72.5%
Maximum100.0%100.0%
Range36.6%27.5%
Mean86.0%85.1%
Median85.5%84.9%
Interquartile 25% (IQ1)84.0%82.7%
Interquartile 75% (IQ3)87.7%86.8%
Interquartile Range (IQR)3.7%4.1%
Standard Deviation (Sample)5.5%5.0%
Standard Deviation (Population)5.5%4.9%

Similar Demographics by In Labor Force | Age 30-34

Demographics Similar to Immigrants from Taiwan by In Labor Force | Age 30-34

In terms of in labor force | age 30-34, the demographic groups most similar to Immigrants from Taiwan are Immigrants from Northern Europe (85.3%, a difference of 0.0%), Immigrants from Belgium (85.3%, a difference of 0.010%), Mongolian (85.3%, a difference of 0.020%), Immigrants from Kazakhstan (85.3%, a difference of 0.020%), and Greek (85.3%, a difference of 0.030%).
DemographicsRating | RankIn Labor Force | Age 30-34
Immigrants | Switzerland
98.7
/100
|
#79
Exceptional
85.3%
Immigrants | Russia
98.7
/100
|
#80
Exceptional
85.3%
Slovaks
98.7
/100
|
#81
Exceptional
85.3%
Immigrants | Africa
98.6
/100
|
#82
Exceptional
85.3%
Immigrants | Europe
98.6
/100
|
#83
Exceptional
85.3%
Greeks
98.6
/100
|
#84
Exceptional
85.3%
Mongolians
98.5
/100
|
#85
Exceptional
85.3%
Immigrants | Taiwan
98.3
/100
|
#86
Exceptional
85.3%
Immigrants | Northern Europe
98.2
/100
|
#87
Exceptional
85.3%
Immigrants | Belgium
98.2
/100
|
#88
Exceptional
85.3%
Immigrants | Kazakhstan
98.1
/100
|
#89
Exceptional
85.3%
Burmese
97.9
/100
|
#90
Exceptional
85.3%
Immigrants | Moldova
97.9
/100
|
#91
Exceptional
85.3%
German Russians
97.7
/100
|
#92
Exceptional
85.2%
Immigrants | Norway
97.6
/100
|
#93
Exceptional
85.2%

Demographics Similar to Armenians by In Labor Force | Age 30-34

In terms of in labor force | age 30-34, the demographic groups most similar to Armenians are Australian (85.0%, a difference of 0.0%), Immigrants from Kuwait (85.1%, a difference of 0.010%), Immigrants from Jordan (85.0%, a difference of 0.020%), Asian (85.1%, a difference of 0.030%), and Immigrants from Southern Europe (85.1%, a difference of 0.030%).
DemographicsRating | RankIn Labor Force | Age 30-34
Egyptians
94.5
/100
|
#116
Exceptional
85.1%
Immigrants | Denmark
94.3
/100
|
#117
Exceptional
85.1%
Immigrants | Malaysia
94.2
/100
|
#118
Exceptional
85.1%
Asians
93.4
/100
|
#119
Exceptional
85.1%
Immigrants | Southern Europe
93.3
/100
|
#120
Exceptional
85.1%
Immigrants | Egypt
93.2
/100
|
#121
Exceptional
85.1%
Immigrants | Kuwait
92.6
/100
|
#122
Exceptional
85.1%
Armenians
92.2
/100
|
#123
Exceptional
85.0%
Australians
92.0
/100
|
#124
Exceptional
85.0%
Immigrants | Jordan
91.5
/100
|
#125
Exceptional
85.0%
Austrians
90.9
/100
|
#126
Exceptional
85.0%
Slavs
90.7
/100
|
#127
Exceptional
85.0%
Immigrants | Argentina
90.6
/100
|
#128
Exceptional
85.0%
Immigrants | Western Africa
90.2
/100
|
#129
Exceptional
85.0%
Immigrants | Spain
90.0
/100
|
#130
Exceptional
85.0%