Pennsylvania German vs Pueblo In Labor Force | Age 16-19
COMPARE
Pennsylvania German
Pueblo
In Labor Force | Age 16-19
In Labor Force | Age 16-19 Comparison
Pennsylvania Germans
Pueblo
46.4%
IN LABOR FORCE | AGE 16-19
100.0/ 100
METRIC RATING
1st/ 347
METRIC RANK
34.9%
IN LABOR FORCE | AGE 16-19
2.6/ 100
METRIC RATING
243rd/ 347
METRIC RANK
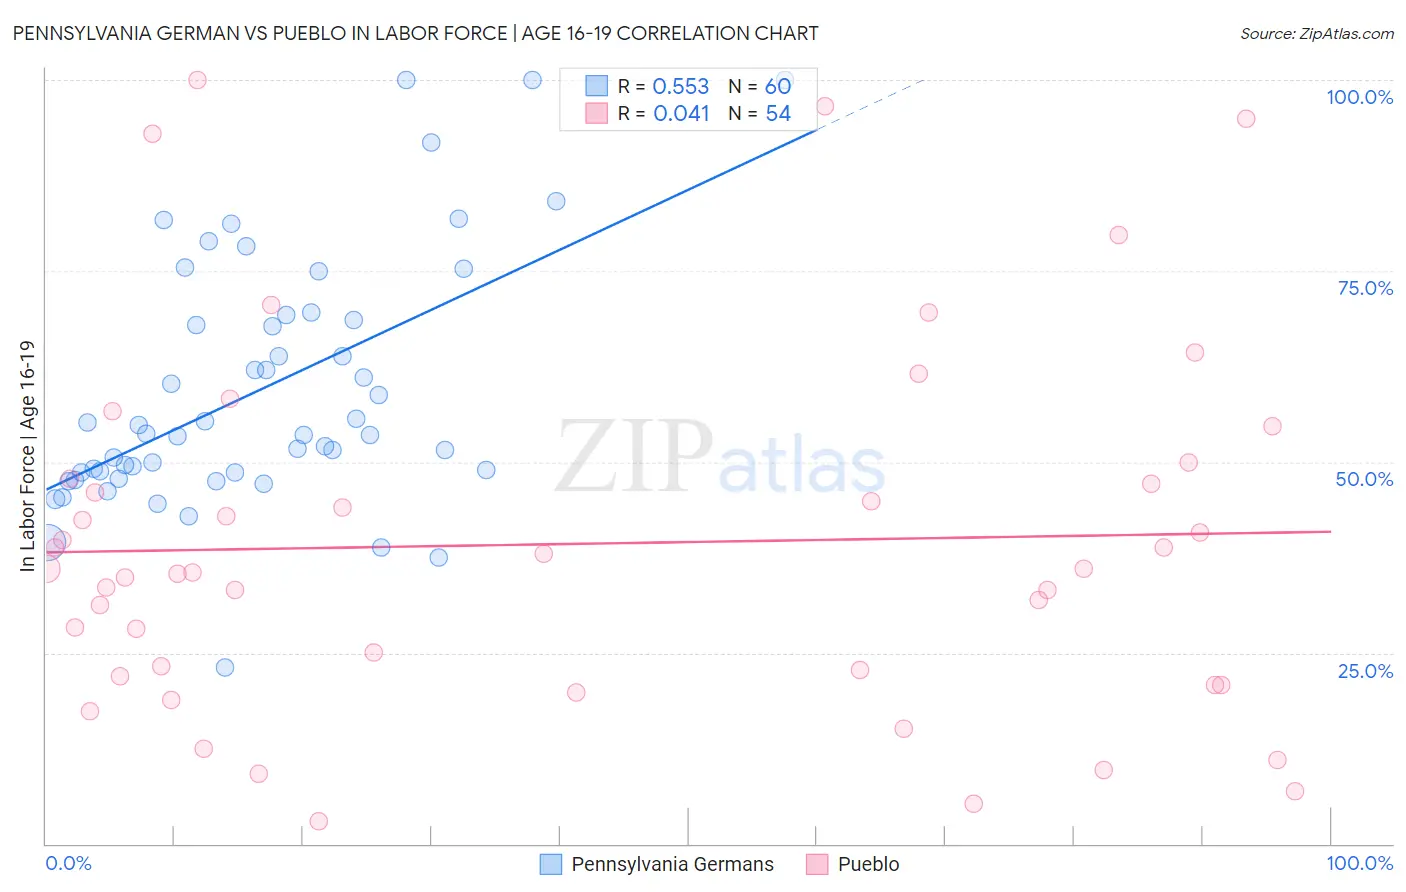
Pennsylvania German vs Pueblo In Labor Force | Age 16-19 Correlation Chart
The statistical analysis conducted on geographies consisting of 233,701,573 people shows a substantial positive correlation between the proportion of Pennsylvania Germans and labor force participation rate among population between the ages 16 and 19 in the United States with a correlation coefficient (R) of 0.553 and weighted average of 46.4%. Similarly, the statistical analysis conducted on geographies consisting of 119,984,829 people shows no correlation between the proportion of Pueblo and labor force participation rate among population between the ages 16 and 19 in the United States with a correlation coefficient (R) of 0.041 and weighted average of 34.9%, a difference of 33.1%.
In Labor Force | Age 16-19 Correlation Summary
| Measurement | Pennsylvania German | Pueblo |
| Minimum | 23.1% | 3.0% |
| Maximum | 100.0% | 100.0% |
| Range | 76.9% | 97.0% |
| Mean | 59.4% | 39.3% |
| Median | 53.7% | 35.8% |
| Interquartile 25% (IQ1) | 48.6% | 21.9% |
| Interquartile 75% (IQ3) | 68.9% | 47.8% |
| Interquartile Range (IQR) | 20.3% | 25.9% |
| Standard Deviation (Sample) | 16.4% | 23.7% |
| Standard Deviation (Population) | 16.2% | 23.5% |
Similar Demographics by In Labor Force | Age 16-19
Demographics Similar to Pennsylvania Germans by In Labor Force | Age 16-19
In terms of in labor force | age 16-19, the demographic groups most similar to Pennsylvania Germans are Norwegian (46.2%, a difference of 0.56%), Immigrants from Somalia (45.6%, a difference of 1.9%), Luxembourger (45.3%, a difference of 2.5%), Alaskan Athabascan (45.2%, a difference of 2.7%), and Somali (45.1%, a difference of 2.9%).
| Demographics | Rating | Rank | In Labor Force | Age 16-19 |
| Pennsylvania Germans | 100.0 /100 | #1 | Exceptional 46.4% |
| Norwegians | 100.0 /100 | #2 | Exceptional 46.2% |
| Immigrants | Somalia | 100.0 /100 | #3 | Exceptional 45.6% |
| Luxembourgers | 100.0 /100 | #4 | Exceptional 45.3% |
| Alaskan Athabascans | 100.0 /100 | #5 | Exceptional 45.2% |
| Somalis | 100.0 /100 | #6 | Exceptional 45.1% |
| Danes | 100.0 /100 | #7 | Exceptional 44.7% |
| Immigrants | Cabo Verde | 100.0 /100 | #8 | Exceptional 44.7% |
| Cape Verdeans | 100.0 /100 | #9 | Exceptional 44.5% |
| Germans | 100.0 /100 | #10 | Exceptional 44.2% |
| Swedes | 100.0 /100 | #11 | Exceptional 44.1% |
| Finns | 100.0 /100 | #12 | Exceptional 43.9% |
| Dutch | 100.0 /100 | #13 | Exceptional 43.8% |
| Chippewa | 100.0 /100 | #14 | Exceptional 43.8% |
| Slovenes | 100.0 /100 | #15 | Exceptional 43.7% |
Demographics Similar to Pueblo by In Labor Force | Age 16-19
In terms of in labor force | age 16-19, the demographic groups most similar to Pueblo are Immigrants from Turkey (34.9%, a difference of 0.020%), Uruguayan (34.9%, a difference of 0.030%), Immigrants from Greece (34.9%, a difference of 0.080%), Immigrants from Sri Lanka (34.9%, a difference of 0.10%), and Laotian (34.9%, a difference of 0.11%).
| Demographics | Rating | Rank | In Labor Force | Age 16-19 |
| Immigrants | Australia | 3.6 /100 | #236 | Tragic 35.1% |
| Immigrants | India | 3.5 /100 | #237 | Tragic 35.0% |
| Immigrants | Vietnam | 3.4 /100 | #238 | Tragic 35.0% |
| Inupiat | 3.2 /100 | #239 | Tragic 35.0% |
| Immigrants | Central America | 3.0 /100 | #240 | Tragic 35.0% |
| Immigrants | Ireland | 2.9 /100 | #241 | Tragic 35.0% |
| Uruguayans | 2.6 /100 | #242 | Tragic 34.9% |
| Pueblo | 2.6 /100 | #243 | Tragic 34.9% |
| Immigrants | Turkey | 2.6 /100 | #244 | Tragic 34.9% |
| Immigrants | Greece | 2.4 /100 | #245 | Tragic 34.9% |
| Immigrants | Sri Lanka | 2.4 /100 | #246 | Tragic 34.9% |
| Laotians | 2.4 /100 | #247 | Tragic 34.9% |
| Central Americans | 2.2 /100 | #248 | Tragic 34.8% |
| Immigrants | Ukraine | 2.2 /100 | #249 | Tragic 34.8% |
| Immigrants | Pakistan | 2.0 /100 | #250 | Tragic 34.8% |