Pennsylvania German vs Paiute In Labor Force | Age 16-19
COMPARE
Pennsylvania German
Paiute
In Labor Force | Age 16-19
In Labor Force | Age 16-19 Comparison
Pennsylvania Germans
Paiute
46.4%
IN LABOR FORCE | AGE 16-19
100.0/ 100
METRIC RATING
1st/ 347
METRIC RANK
37.5%
IN LABOR FORCE | AGE 16-19
89.3/ 100
METRIC RATING
145th/ 347
METRIC RANK
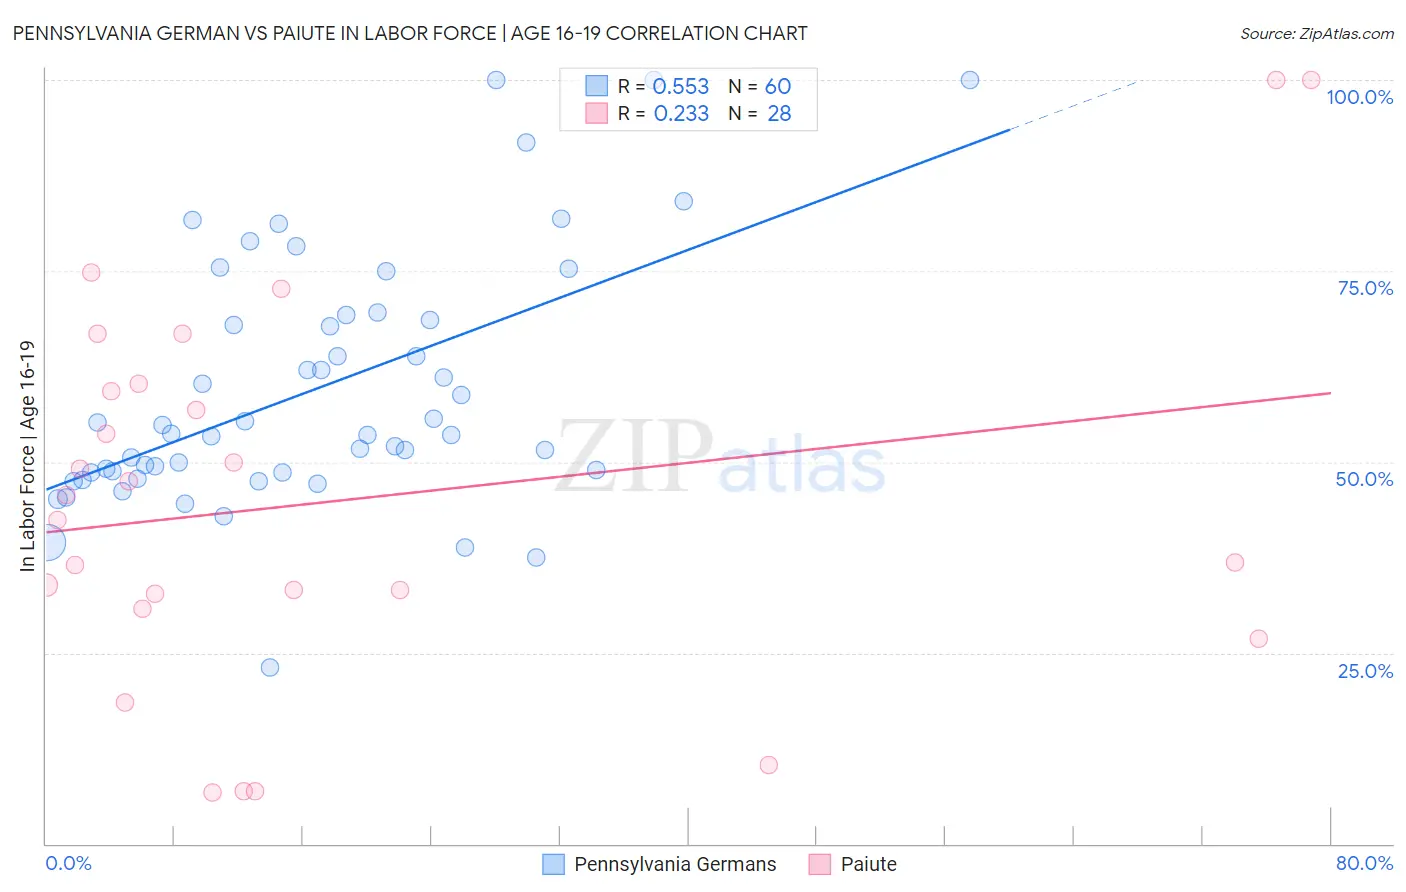
Pennsylvania German vs Paiute In Labor Force | Age 16-19 Correlation Chart
The statistical analysis conducted on geographies consisting of 233,701,573 people shows a substantial positive correlation between the proportion of Pennsylvania Germans and labor force participation rate among population between the ages 16 and 19 in the United States with a correlation coefficient (R) of 0.553 and weighted average of 46.4%. Similarly, the statistical analysis conducted on geographies consisting of 58,354,197 people shows a weak positive correlation between the proportion of Paiute and labor force participation rate among population between the ages 16 and 19 in the United States with a correlation coefficient (R) of 0.233 and weighted average of 37.5%, a difference of 23.7%.
In Labor Force | Age 16-19 Correlation Summary
| Measurement | Pennsylvania German | Paiute |
| Minimum | 23.1% | 6.7% |
| Maximum | 100.0% | 100.0% |
| Range | 76.9% | 93.3% |
| Mean | 59.4% | 45.0% |
| Median | 53.7% | 44.1% |
| Interquartile 25% (IQ1) | 48.6% | 31.7% |
| Interquartile 75% (IQ3) | 68.9% | 59.8% |
| Interquartile Range (IQR) | 20.3% | 28.1% |
| Standard Deviation (Sample) | 16.4% | 25.0% |
| Standard Deviation (Population) | 16.2% | 24.5% |
Similar Demographics by In Labor Force | Age 16-19
Demographics Similar to Pennsylvania Germans by In Labor Force | Age 16-19
In terms of in labor force | age 16-19, the demographic groups most similar to Pennsylvania Germans are Norwegian (46.2%, a difference of 0.56%), Immigrants from Somalia (45.6%, a difference of 1.9%), Luxembourger (45.3%, a difference of 2.5%), Alaskan Athabascan (45.2%, a difference of 2.7%), and Somali (45.1%, a difference of 2.9%).
| Demographics | Rating | Rank | In Labor Force | Age 16-19 |
| Pennsylvania Germans | 100.0 /100 | #1 | Exceptional 46.4% |
| Norwegians | 100.0 /100 | #2 | Exceptional 46.2% |
| Immigrants | Somalia | 100.0 /100 | #3 | Exceptional 45.6% |
| Luxembourgers | 100.0 /100 | #4 | Exceptional 45.3% |
| Alaskan Athabascans | 100.0 /100 | #5 | Exceptional 45.2% |
| Somalis | 100.0 /100 | #6 | Exceptional 45.1% |
| Danes | 100.0 /100 | #7 | Exceptional 44.7% |
| Immigrants | Cabo Verde | 100.0 /100 | #8 | Exceptional 44.7% |
| Cape Verdeans | 100.0 /100 | #9 | Exceptional 44.5% |
| Germans | 100.0 /100 | #10 | Exceptional 44.2% |
| Swedes | 100.0 /100 | #11 | Exceptional 44.1% |
| Finns | 100.0 /100 | #12 | Exceptional 43.9% |
| Dutch | 100.0 /100 | #13 | Exceptional 43.8% |
| Chippewa | 100.0 /100 | #14 | Exceptional 43.8% |
| Slovenes | 100.0 /100 | #15 | Exceptional 43.7% |
Demographics Similar to Paiute by In Labor Force | Age 16-19
In terms of in labor force | age 16-19, the demographic groups most similar to Paiute are Japanese (37.5%, a difference of 0.0%), Pakistani (37.6%, a difference of 0.020%), Sierra Leonean (37.6%, a difference of 0.050%), Immigrants from Western Europe (37.5%, a difference of 0.050%), and Brazilian (37.5%, a difference of 0.080%).
| Demographics | Rating | Rank | In Labor Force | Age 16-19 |
| Comanche | 91.9 /100 | #138 | Exceptional 37.7% |
| Immigrants | Moldova | 91.9 /100 | #139 | Exceptional 37.7% |
| Estonians | 91.7 /100 | #140 | Exceptional 37.7% |
| Syrians | 90.7 /100 | #141 | Exceptional 37.6% |
| Sierra Leoneans | 89.7 /100 | #142 | Excellent 37.6% |
| Pakistanis | 89.5 /100 | #143 | Excellent 37.6% |
| Japanese | 89.3 /100 | #144 | Excellent 37.5% |
| Paiute | 89.3 /100 | #145 | Excellent 37.5% |
| Immigrants | Western Europe | 88.9 /100 | #146 | Excellent 37.5% |
| Brazilians | 88.7 /100 | #147 | Excellent 37.5% |
| Romanians | 87.3 /100 | #148 | Excellent 37.5% |
| Native Hawaiians | 85.0 /100 | #149 | Excellent 37.4% |
| Tsimshian | 84.7 /100 | #150 | Excellent 37.4% |
| Immigrants | Poland | 84.4 /100 | #151 | Excellent 37.3% |
| Immigrants | Sierra Leone | 83.6 /100 | #152 | Excellent 37.3% |