Honduran vs Pueblo In Labor Force | Age 16-19
COMPARE
Honduran
Pueblo
In Labor Force | Age 16-19
In Labor Force | Age 16-19 Comparison
Hondurans
Pueblo
35.3%
IN LABOR FORCE | AGE 16-19
6.5/ 100
METRIC RATING
224th/ 347
METRIC RANK
34.9%
IN LABOR FORCE | AGE 16-19
2.6/ 100
METRIC RATING
243rd/ 347
METRIC RANK
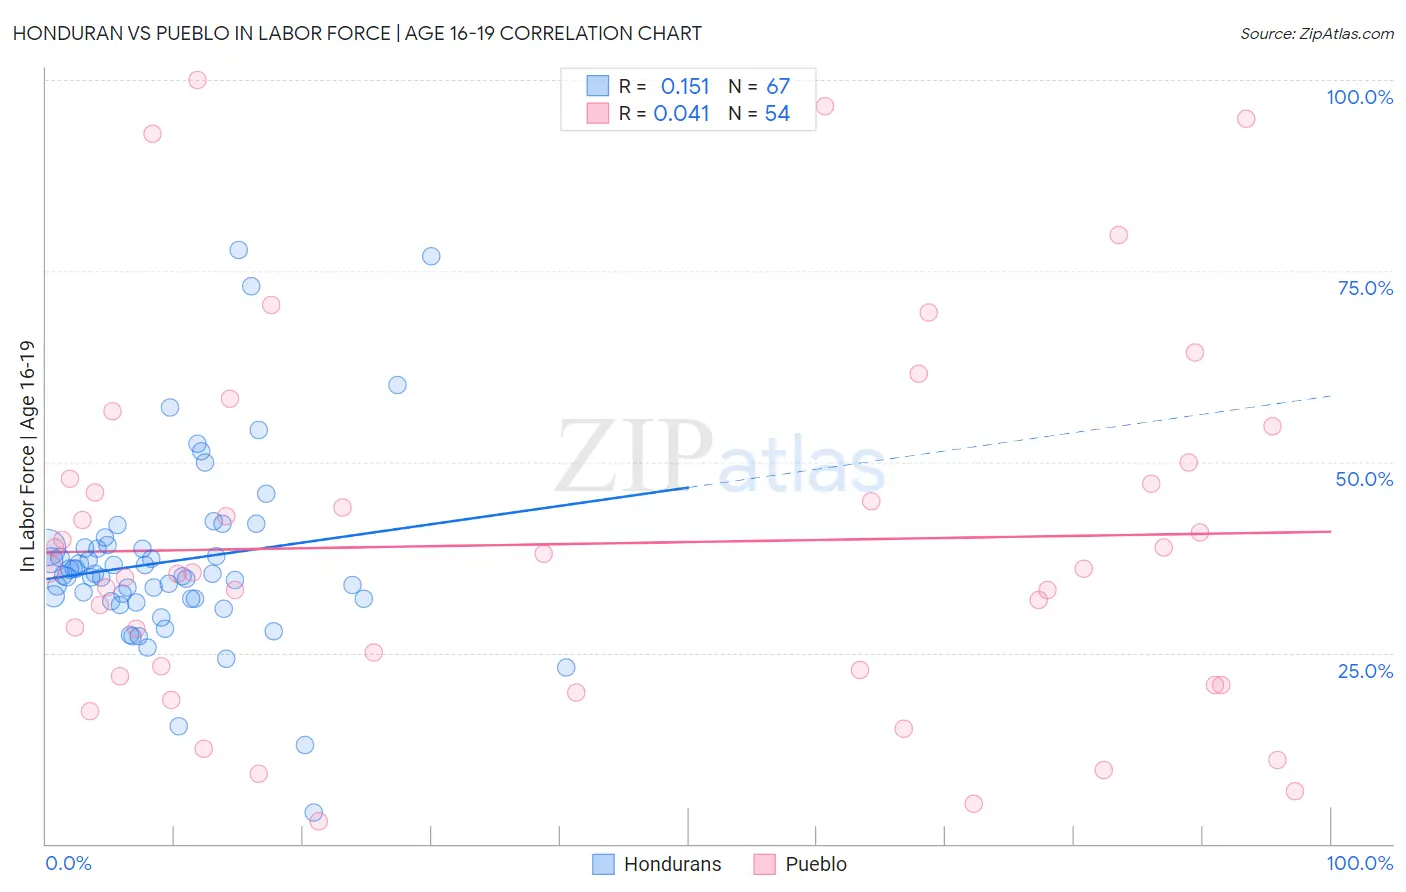
Honduran vs Pueblo In Labor Force | Age 16-19 Correlation Chart
The statistical analysis conducted on geographies consisting of 357,451,024 people shows a poor positive correlation between the proportion of Hondurans and labor force participation rate among population between the ages 16 and 19 in the United States with a correlation coefficient (R) of 0.151 and weighted average of 35.3%. Similarly, the statistical analysis conducted on geographies consisting of 119,984,829 people shows no correlation between the proportion of Pueblo and labor force participation rate among population between the ages 16 and 19 in the United States with a correlation coefficient (R) of 0.041 and weighted average of 34.9%, a difference of 1.3%.
In Labor Force | Age 16-19 Correlation Summary
| Measurement | Honduran | Pueblo |
| Minimum | 4.1% | 3.0% |
| Maximum | 77.8% | 100.0% |
| Range | 73.7% | 97.0% |
| Mean | 37.0% | 39.3% |
| Median | 35.1% | 35.8% |
| Interquartile 25% (IQ1) | 32.0% | 21.9% |
| Interquartile 75% (IQ3) | 38.8% | 47.8% |
| Interquartile Range (IQR) | 6.8% | 25.9% |
| Standard Deviation (Sample) | 12.4% | 23.7% |
| Standard Deviation (Population) | 12.3% | 23.5% |
Demographics Similar to Hondurans and Pueblo by In Labor Force | Age 16-19
In terms of in labor force | age 16-19, the demographic groups most similar to Hondurans are Ghanaian (35.3%, a difference of 0.020%), Immigrants from Belgium (35.3%, a difference of 0.080%), Immigrants from Guatemala (35.3%, a difference of 0.17%), Mongolian (35.3%, a difference of 0.18%), and Immigrants from Senegal (35.3%, a difference of 0.23%). Similarly, the demographic groups most similar to Pueblo are Uruguayan (34.9%, a difference of 0.030%), Immigrants from Ireland (35.0%, a difference of 0.15%), Immigrants from Central America (35.0%, a difference of 0.18%), Inupiat (35.0%, a difference of 0.28%), and Immigrants from Vietnam (35.0%, a difference of 0.37%).
| Demographics | Rating | Rank | In Labor Force | Age 16-19 |
| Ghanaians | 6.5 /100 | #223 | Tragic 35.3% |
| Hondurans | 6.5 /100 | #224 | Tragic 35.3% |
| Immigrants | Belgium | 6.1 /100 | #225 | Tragic 35.3% |
| Immigrants | Guatemala | 5.7 /100 | #226 | Tragic 35.3% |
| Mongolians | 5.7 /100 | #227 | Tragic 35.3% |
| Immigrants | Senegal | 5.5 /100 | #228 | Tragic 35.3% |
| Immigrants | Lebanon | 5.0 /100 | #229 | Tragic 35.2% |
| Immigrants | Honduras | 4.9 /100 | #230 | Tragic 35.2% |
| Immigrants | Syria | 4.5 /100 | #231 | Tragic 35.2% |
| Immigrants | Kazakhstan | 4.5 /100 | #232 | Tragic 35.2% |
| Immigrants | France | 4.3 /100 | #233 | Tragic 35.1% |
| Immigrants | Mexico | 4.2 /100 | #234 | Tragic 35.1% |
| Immigrants | Philippines | 4.0 /100 | #235 | Tragic 35.1% |
| Immigrants | Australia | 3.6 /100 | #236 | Tragic 35.1% |
| Immigrants | India | 3.5 /100 | #237 | Tragic 35.0% |
| Immigrants | Vietnam | 3.4 /100 | #238 | Tragic 35.0% |
| Inupiat | 3.2 /100 | #239 | Tragic 35.0% |
| Immigrants | Central America | 3.0 /100 | #240 | Tragic 35.0% |
| Immigrants | Ireland | 2.9 /100 | #241 | Tragic 35.0% |
| Uruguayans | 2.6 /100 | #242 | Tragic 34.9% |
| Pueblo | 2.6 /100 | #243 | Tragic 34.9% |