Nonimmigrants vs Yup'ik In Labor Force | Age 35-44
COMPARE
Nonimmigrants
Yup'ik
In Labor Force | Age 35-44
In Labor Force | Age 35-44 Comparison
Nonimmigrants
Yup'ik
83.2%
IN LABOR FORCE | AGE 35-44
0.0/ 100
METRIC RATING
274th/ 347
METRIC RANK
77.3%
IN LABOR FORCE | AGE 35-44
0.0/ 100
METRIC RATING
339th/ 347
METRIC RANK
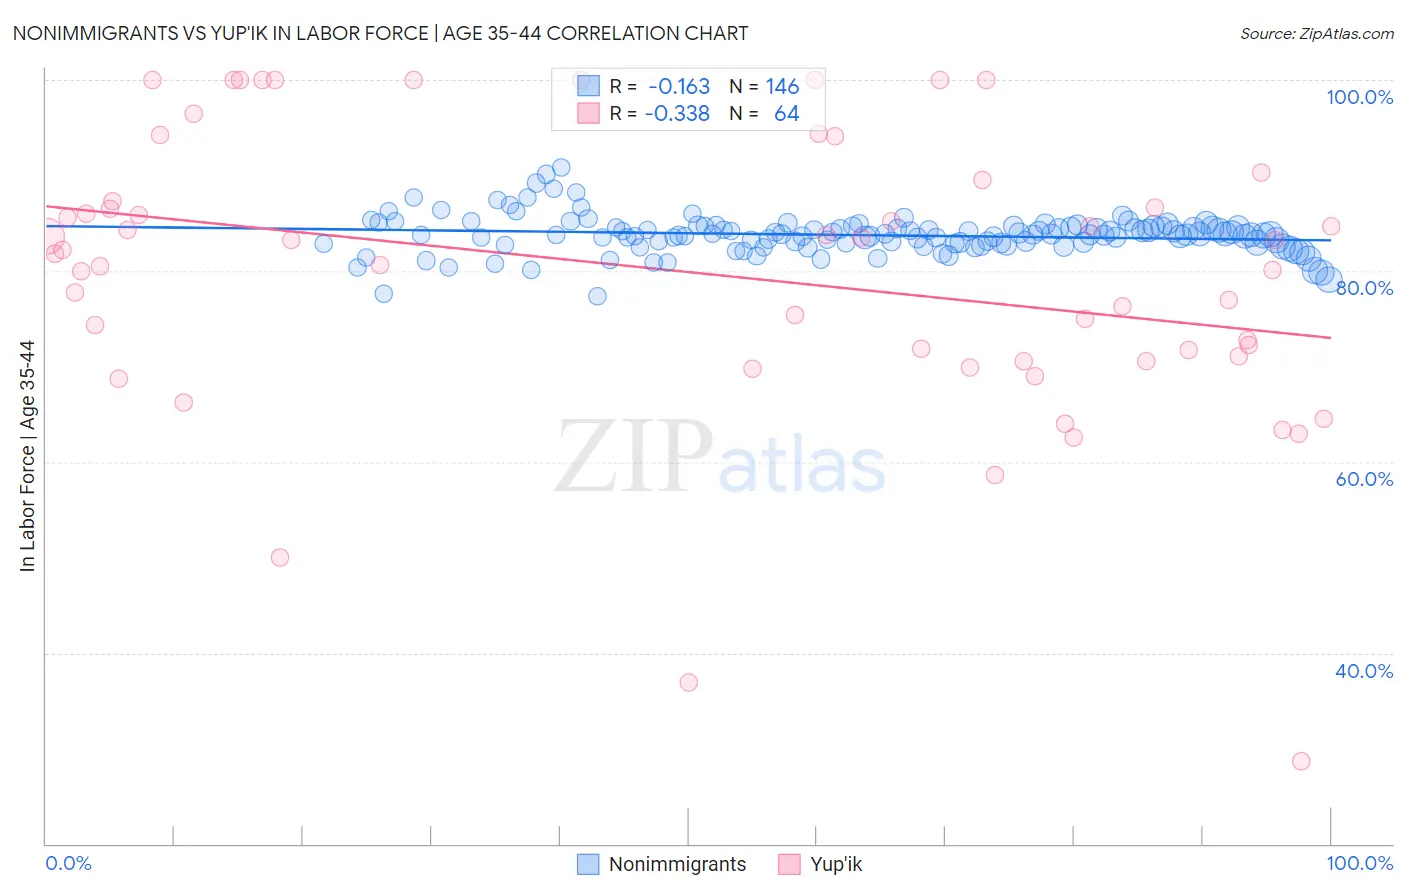
Nonimmigrants vs Yup'ik In Labor Force | Age 35-44 Correlation Chart
The statistical analysis conducted on geographies consisting of 584,065,526 people shows a poor negative correlation between the proportion of Nonimmigrants and labor force participation rate among population between the ages 35 and 44 in the United States with a correlation coefficient (R) of -0.163 and weighted average of 83.2%. Similarly, the statistical analysis conducted on geographies consisting of 39,956,456 people shows a mild negative correlation between the proportion of Yup'ik and labor force participation rate among population between the ages 35 and 44 in the United States with a correlation coefficient (R) of -0.338 and weighted average of 77.3%, a difference of 7.7%.
In Labor Force | Age 35-44 Correlation Summary
| Measurement | Nonimmigrants | Yup'ik |
| Minimum | 77.4% | 28.6% |
| Maximum | 90.8% | 100.0% |
| Range | 13.4% | 71.4% |
| Mean | 83.8% | 79.8% |
| Median | 83.8% | 82.0% |
| Interquartile 25% (IQ1) | 82.9% | 70.8% |
| Interquartile 75% (IQ3) | 84.6% | 88.4% |
| Interquartile Range (IQR) | 1.7% | 17.6% |
| Standard Deviation (Sample) | 2.0% | 14.9% |
| Standard Deviation (Population) | 2.0% | 14.8% |
Similar Demographics by In Labor Force | Age 35-44
Demographics Similar to Nonimmigrants by In Labor Force | Age 35-44
In terms of in labor force | age 35-44, the demographic groups most similar to Nonimmigrants are Immigrants from Fiji (83.2%, a difference of 0.020%), Spanish (83.2%, a difference of 0.020%), Hawaiian (83.2%, a difference of 0.020%), Delaware (83.2%, a difference of 0.030%), and Samoan (83.2%, a difference of 0.030%).
| Demographics | Rating | Rank | In Labor Force | Age 35-44 |
| Guamanians/Chamorros | 0.1 /100 | #267 | Tragic 83.4% |
| Hondurans | 0.1 /100 | #268 | Tragic 83.4% |
| Immigrants | Grenada | 0.1 /100 | #269 | Tragic 83.3% |
| Immigrants | Honduras | 0.0 /100 | #270 | Tragic 83.3% |
| French American Indians | 0.0 /100 | #271 | Tragic 83.2% |
| Immigrants | Fiji | 0.0 /100 | #272 | Tragic 83.2% |
| Spanish | 0.0 /100 | #273 | Tragic 83.2% |
| Immigrants | Nonimmigrants | 0.0 /100 | #274 | Tragic 83.2% |
| Hawaiians | 0.0 /100 | #275 | Tragic 83.2% |
| Delaware | 0.0 /100 | #276 | Tragic 83.2% |
| Samoans | 0.0 /100 | #277 | Tragic 83.2% |
| Belizeans | 0.0 /100 | #278 | Tragic 83.1% |
| Immigrants | Micronesia | 0.0 /100 | #279 | Tragic 83.1% |
| Dominicans | 0.0 /100 | #280 | Tragic 83.1% |
| Guatemalans | 0.0 /100 | #281 | Tragic 83.0% |
Demographics Similar to Yup'ik by In Labor Force | Age 35-44
In terms of in labor force | age 35-44, the demographic groups most similar to Yup'ik are Pueblo (77.4%, a difference of 0.10%), Lumbee (77.0%, a difference of 0.35%), Hopi (77.0%, a difference of 0.40%), Apache (77.9%, a difference of 0.81%), and Arapaho (78.1%, a difference of 1.0%).
| Demographics | Rating | Rank | In Labor Force | Age 35-44 |
| Ute | 0.0 /100 | #332 | Tragic 79.4% |
| Kiowa | 0.0 /100 | #333 | Tragic 79.2% |
| Yakama | 0.0 /100 | #334 | Tragic 79.0% |
| Natives/Alaskans | 0.0 /100 | #335 | Tragic 78.9% |
| Arapaho | 0.0 /100 | #336 | Tragic 78.1% |
| Apache | 0.0 /100 | #337 | Tragic 77.9% |
| Pueblo | 0.0 /100 | #338 | Tragic 77.4% |
| Yup'ik | 0.0 /100 | #339 | Tragic 77.3% |
| Lumbee | 0.0 /100 | #340 | Tragic 77.0% |
| Hopi | 0.0 /100 | #341 | Tragic 77.0% |
| Crow | 0.0 /100 | #342 | Tragic 76.5% |
| Immigrants | Yemen | 0.0 /100 | #343 | Tragic 76.3% |
| Pima | 0.0 /100 | #344 | Tragic 74.8% |
| Yuman | 0.0 /100 | #345 | Tragic 74.7% |
| Tohono O'odham | 0.0 /100 | #346 | Tragic 74.1% |