Spanish vs Alaska Native In Labor Force | Age 25-29
COMPARE
Spanish
Alaska Native
In Labor Force | Age 25-29
In Labor Force | Age 25-29 Comparison
Spanish
Alaska Natives
83.6%
IN LABOR FORCE | AGE 25-29
0.1/ 100
METRIC RATING
259th/ 347
METRIC RANK
81.6%
IN LABOR FORCE | AGE 25-29
0.0/ 100
METRIC RATING
323rd/ 347
METRIC RANK
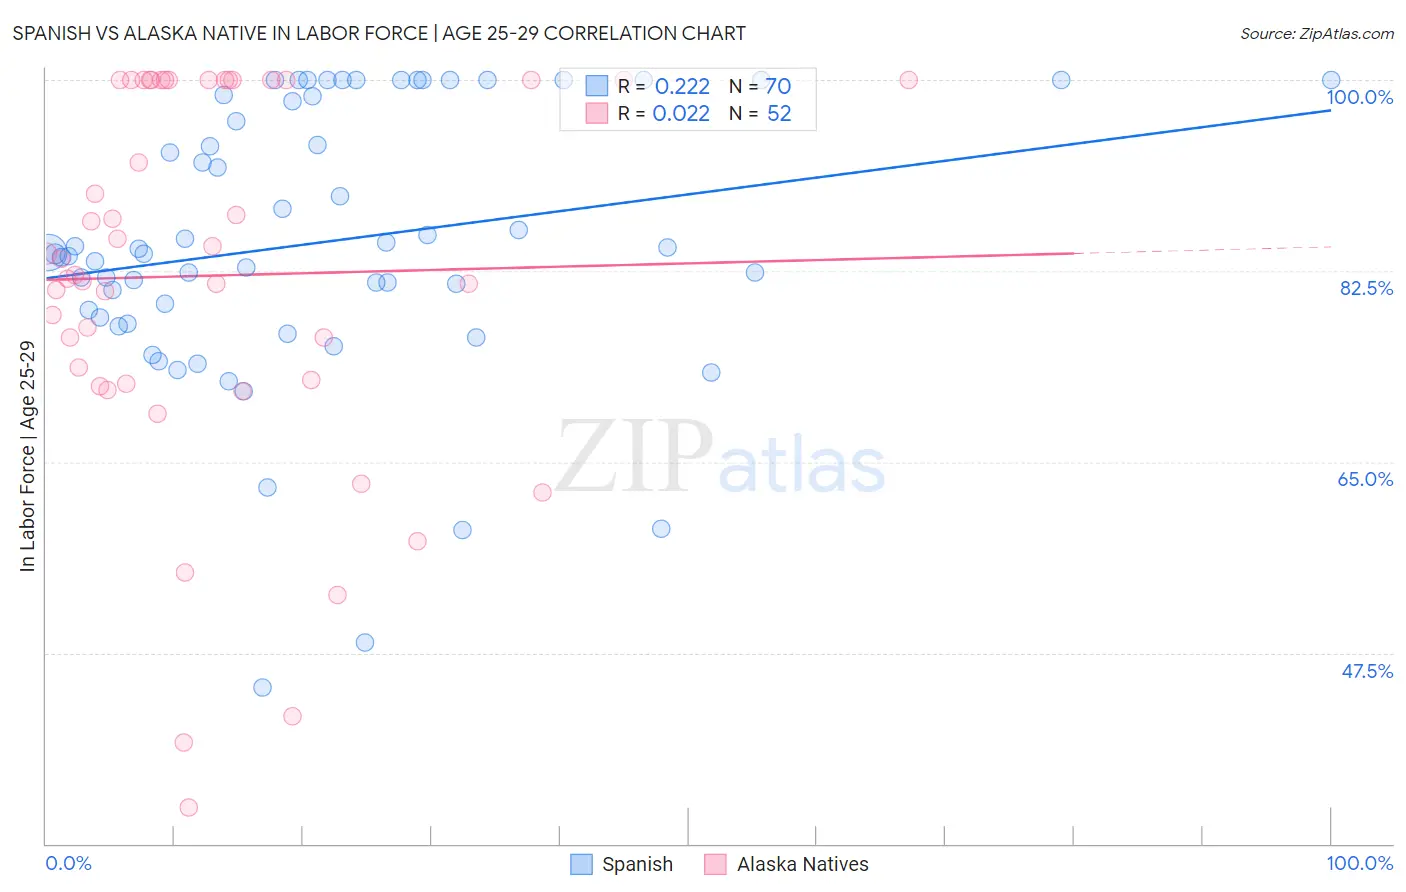
Spanish vs Alaska Native In Labor Force | Age 25-29 Correlation Chart
The statistical analysis conducted on geographies consisting of 421,954,329 people shows a weak positive correlation between the proportion of Spanish and labor force participation rate among population between the ages 25 and 29 in the United States with a correlation coefficient (R) of 0.222 and weighted average of 83.6%. Similarly, the statistical analysis conducted on geographies consisting of 76,769,069 people shows no correlation between the proportion of Alaska Natives and labor force participation rate among population between the ages 25 and 29 in the United States with a correlation coefficient (R) of 0.022 and weighted average of 81.6%, a difference of 2.5%.
In Labor Force | Age 25-29 Correlation Summary
| Measurement | Spanish | Alaska Native |
| Minimum | 44.3% | 33.3% |
| Maximum | 100.0% | 100.0% |
| Range | 55.7% | 66.7% |
| Mean | 85.1% | 82.1% |
| Median | 84.1% | 82.8% |
| Interquartile 25% (IQ1) | 78.3% | 72.3% |
| Interquartile 75% (IQ3) | 98.6% | 100.0% |
| Interquartile Range (IQR) | 20.3% | 27.7% |
| Standard Deviation (Sample) | 12.6% | 17.4% |
| Standard Deviation (Population) | 12.5% | 17.2% |
Similar Demographics by In Labor Force | Age 25-29
Demographics Similar to Spanish by In Labor Force | Age 25-29
In terms of in labor force | age 25-29, the demographic groups most similar to Spanish are Immigrants from Guatemala (83.6%, a difference of 0.010%), Immigrants from Bahamas (83.6%, a difference of 0.010%), Pennsylvania German (83.6%, a difference of 0.010%), Immigrants from Haiti (83.7%, a difference of 0.050%), and Delaware (83.7%, a difference of 0.050%).
| Demographics | Rating | Rank | In Labor Force | Age 25-29 |
| Guatemalans | 0.2 /100 | #252 | Tragic 83.7% |
| Immigrants | Trinidad and Tobago | 0.2 /100 | #253 | Tragic 83.7% |
| Spaniards | 0.2 /100 | #254 | Tragic 83.7% |
| Haitians | 0.2 /100 | #255 | Tragic 83.7% |
| Immigrants | Haiti | 0.2 /100 | #256 | Tragic 83.7% |
| Delaware | 0.2 /100 | #257 | Tragic 83.7% |
| Immigrants | Guatemala | 0.1 /100 | #258 | Tragic 83.6% |
| Spanish | 0.1 /100 | #259 | Tragic 83.6% |
| Immigrants | Bahamas | 0.1 /100 | #260 | Tragic 83.6% |
| Pennsylvania Germans | 0.1 /100 | #261 | Tragic 83.6% |
| Immigrants | Fiji | 0.1 /100 | #262 | Tragic 83.6% |
| West Indians | 0.1 /100 | #263 | Tragic 83.5% |
| Puget Sound Salish | 0.1 /100 | #264 | Tragic 83.5% |
| Cubans | 0.1 /100 | #265 | Tragic 83.5% |
| Aleuts | 0.0 /100 | #266 | Tragic 83.4% |
Demographics Similar to Alaska Natives by In Labor Force | Age 25-29
In terms of in labor force | age 25-29, the demographic groups most similar to Alaska Natives are Kiowa (81.6%, a difference of 0.050%), Shoshone (81.6%, a difference of 0.060%), Colville (81.6%, a difference of 0.11%), Seminole (81.7%, a difference of 0.16%), and Comanche (81.9%, a difference of 0.38%).
| Demographics | Rating | Rank | In Labor Force | Age 25-29 |
| Mexicans | 0.0 /100 | #316 | Tragic 81.9% |
| Chickasaw | 0.0 /100 | #317 | Tragic 81.9% |
| Comanche | 0.0 /100 | #318 | Tragic 81.9% |
| Seminole | 0.0 /100 | #319 | Tragic 81.7% |
| Colville | 0.0 /100 | #320 | Tragic 81.6% |
| Shoshone | 0.0 /100 | #321 | Tragic 81.6% |
| Kiowa | 0.0 /100 | #322 | Tragic 81.6% |
| Alaska Natives | 0.0 /100 | #323 | Tragic 81.6% |
| Houma | 0.0 /100 | #324 | Tragic 81.2% |
| Dutch West Indians | 0.0 /100 | #325 | Tragic 81.1% |
| Choctaw | 0.0 /100 | #326 | Tragic 81.0% |
| Ute | 0.0 /100 | #327 | Tragic 80.8% |
| Creek | 0.0 /100 | #328 | Tragic 80.7% |
| Yakama | 0.0 /100 | #329 | Tragic 80.6% |
| Puerto Ricans | 0.0 /100 | #330 | Tragic 80.4% |