Immigrants from Middle Africa vs Alaskan Athabascan In Labor Force | Age > 16
COMPARE
Immigrants from Middle Africa
Alaskan Athabascan
In Labor Force | Age > 16
In Labor Force | Age > 16 Comparison
Immigrants from Middle Africa
Alaskan Athabascans
67.7%
IN LABOR FORCE | AGE > 16
100.0/ 100
METRIC RATING
15th/ 347
METRIC RANK
64.8%
IN LABOR FORCE | AGE > 16
13.9/ 100
METRIC RATING
212th/ 347
METRIC RANK
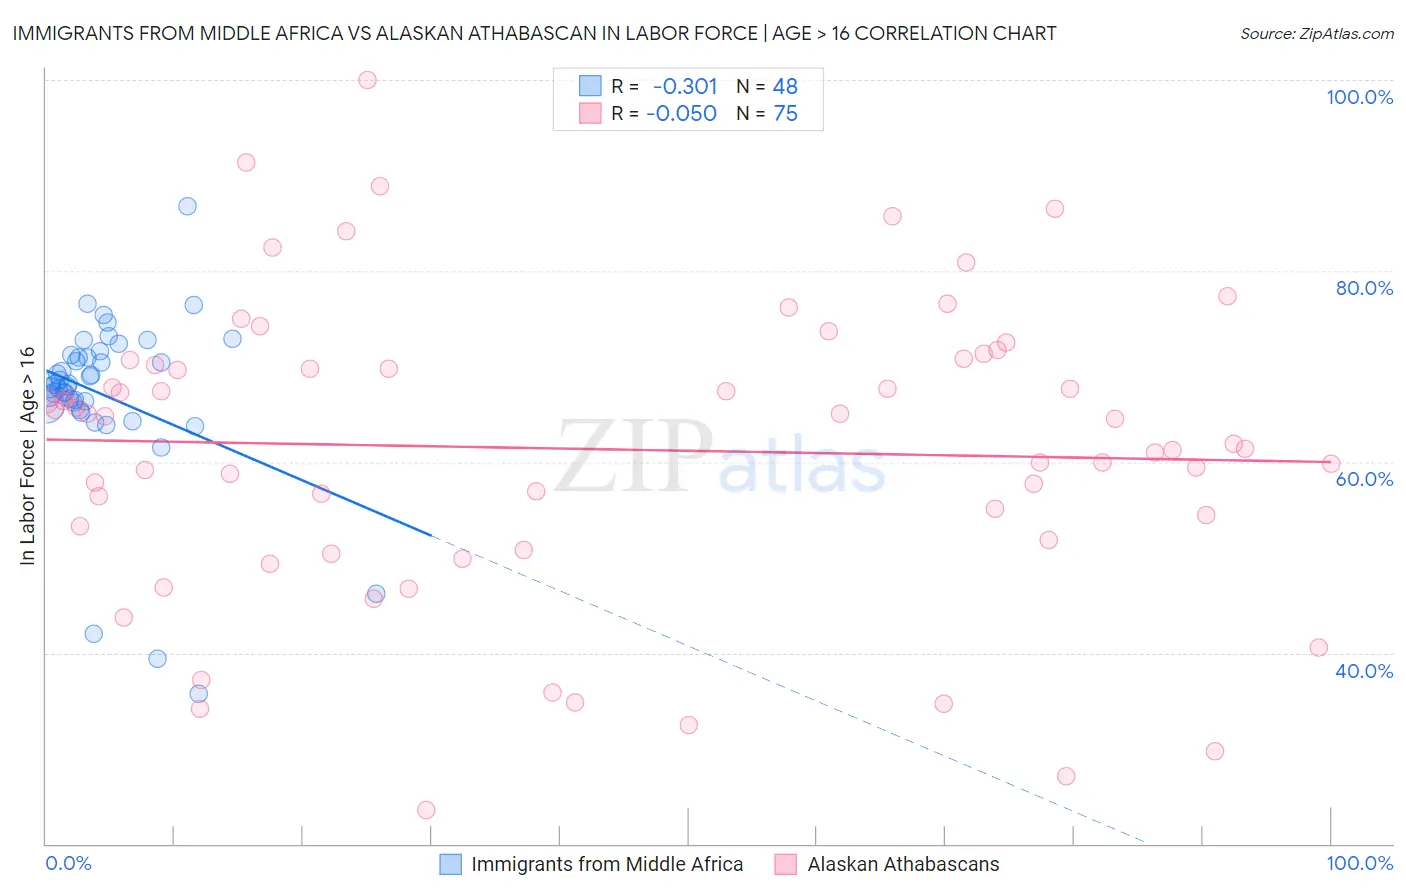
Immigrants from Middle Africa vs Alaskan Athabascan In Labor Force | Age > 16 Correlation Chart
The statistical analysis conducted on geographies consisting of 202,740,845 people shows a mild negative correlation between the proportion of Immigrants from Middle Africa and labor force participation rate among population ages 16 and over in the United States with a correlation coefficient (R) of -0.301 and weighted average of 67.7%. Similarly, the statistical analysis conducted on geographies consisting of 45,821,503 people shows no correlation between the proportion of Alaskan Athabascans and labor force participation rate among population ages 16 and over in the United States with a correlation coefficient (R) of -0.050 and weighted average of 64.8%, a difference of 4.6%.
In Labor Force | Age > 16 Correlation Summary
| Measurement | Immigrants from Middle Africa | Alaskan Athabascan |
| Minimum | 35.7% | 23.6% |
| Maximum | 86.8% | 100.0% |
| Range | 51.1% | 76.4% |
| Mean | 67.0% | 61.3% |
| Median | 68.2% | 64.5% |
| Interquartile 25% (IQ1) | 66.1% | 51.8% |
| Interquartile 75% (IQ3) | 71.1% | 70.6% |
| Interquartile Range (IQR) | 5.0% | 18.8% |
| Standard Deviation (Sample) | 9.1% | 15.7% |
| Standard Deviation (Population) | 9.0% | 15.6% |
Similar Demographics by In Labor Force | Age > 16
Demographics Similar to Immigrants from Middle Africa by In Labor Force | Age > 16
In terms of in labor force | age > 16, the demographic groups most similar to Immigrants from Middle Africa are Liberian (67.8%, a difference of 0.050%), Immigrants from Sudan (67.7%, a difference of 0.11%), Immigrants from India (67.6%, a difference of 0.18%), Immigrants from Liberia (67.6%, a difference of 0.20%), and Kenyan (67.6%, a difference of 0.24%).
| Demographics | Rating | Rank | In Labor Force | Age > 16 |
| Immigrants | Sierra Leone | 100.0 /100 | #8 | Exceptional 68.5% |
| Immigrants | Eastern Africa | 100.0 /100 | #9 | Exceptional 68.5% |
| Immigrants | Bolivia | 100.0 /100 | #10 | Exceptional 68.4% |
| Bolivians | 100.0 /100 | #11 | Exceptional 68.2% |
| Sudanese | 100.0 /100 | #12 | Exceptional 68.0% |
| Immigrants | Nepal | 100.0 /100 | #13 | Exceptional 68.0% |
| Liberians | 100.0 /100 | #14 | Exceptional 67.8% |
| Immigrants | Middle Africa | 100.0 /100 | #15 | Exceptional 67.7% |
| Immigrants | Sudan | 100.0 /100 | #16 | Exceptional 67.7% |
| Immigrants | India | 100.0 /100 | #17 | Exceptional 67.6% |
| Immigrants | Liberia | 100.0 /100 | #18 | Exceptional 67.6% |
| Kenyans | 100.0 /100 | #19 | Exceptional 67.6% |
| Immigrants | Kenya | 100.0 /100 | #20 | Exceptional 67.6% |
| Tongans | 100.0 /100 | #21 | Exceptional 67.5% |
| Immigrants | Uganda | 100.0 /100 | #22 | Exceptional 67.5% |
Demographics Similar to Alaskan Athabascans by In Labor Force | Age > 16
In terms of in labor force | age > 16, the demographic groups most similar to Alaskan Athabascans are Maltese (64.8%, a difference of 0.0%), Fijian (64.8%, a difference of 0.010%), Immigrants from Denmark (64.8%, a difference of 0.020%), Estonian (64.8%, a difference of 0.020%), and Immigrants from Trinidad and Tobago (64.8%, a difference of 0.040%).
| Demographics | Rating | Rank | In Labor Force | Age > 16 |
| Jamaicans | 18.7 /100 | #205 | Poor 64.9% |
| Lithuanians | 17.4 /100 | #206 | Poor 64.8% |
| Immigrants | Latin America | 16.4 /100 | #207 | Poor 64.8% |
| Belizeans | 16.2 /100 | #208 | Poor 64.8% |
| Immigrants | Trinidad and Tobago | 15.6 /100 | #209 | Poor 64.8% |
| Immigrants | Denmark | 14.7 /100 | #210 | Poor 64.8% |
| Fijians | 14.1 /100 | #211 | Poor 64.8% |
| Alaskan Athabascans | 13.9 /100 | #212 | Poor 64.8% |
| Maltese | 13.8 /100 | #213 | Poor 64.8% |
| Estonians | 13.1 /100 | #214 | Poor 64.8% |
| Immigrants | Czechoslovakia | 12.3 /100 | #215 | Poor 64.8% |
| Belgians | 11.4 /100 | #216 | Poor 64.7% |
| U.S. Virgin Islanders | 11.3 /100 | #217 | Poor 64.7% |
| Alsatians | 10.7 /100 | #218 | Poor 64.7% |
| Immigrants | Central America | 10.5 /100 | #219 | Poor 64.7% |