Immigrants from Barbados vs Alaskan Athabascan In Labor Force | Age > 16
COMPARE
Immigrants from Barbados
Alaskan Athabascan
In Labor Force | Age > 16
In Labor Force | Age > 16 Comparison
Immigrants from Barbados
Alaskan Athabascans
64.4%
IN LABOR FORCE | AGE > 16
2.1/ 100
METRIC RATING
248th/ 347
METRIC RANK
64.8%
IN LABOR FORCE | AGE > 16
13.9/ 100
METRIC RATING
212th/ 347
METRIC RANK
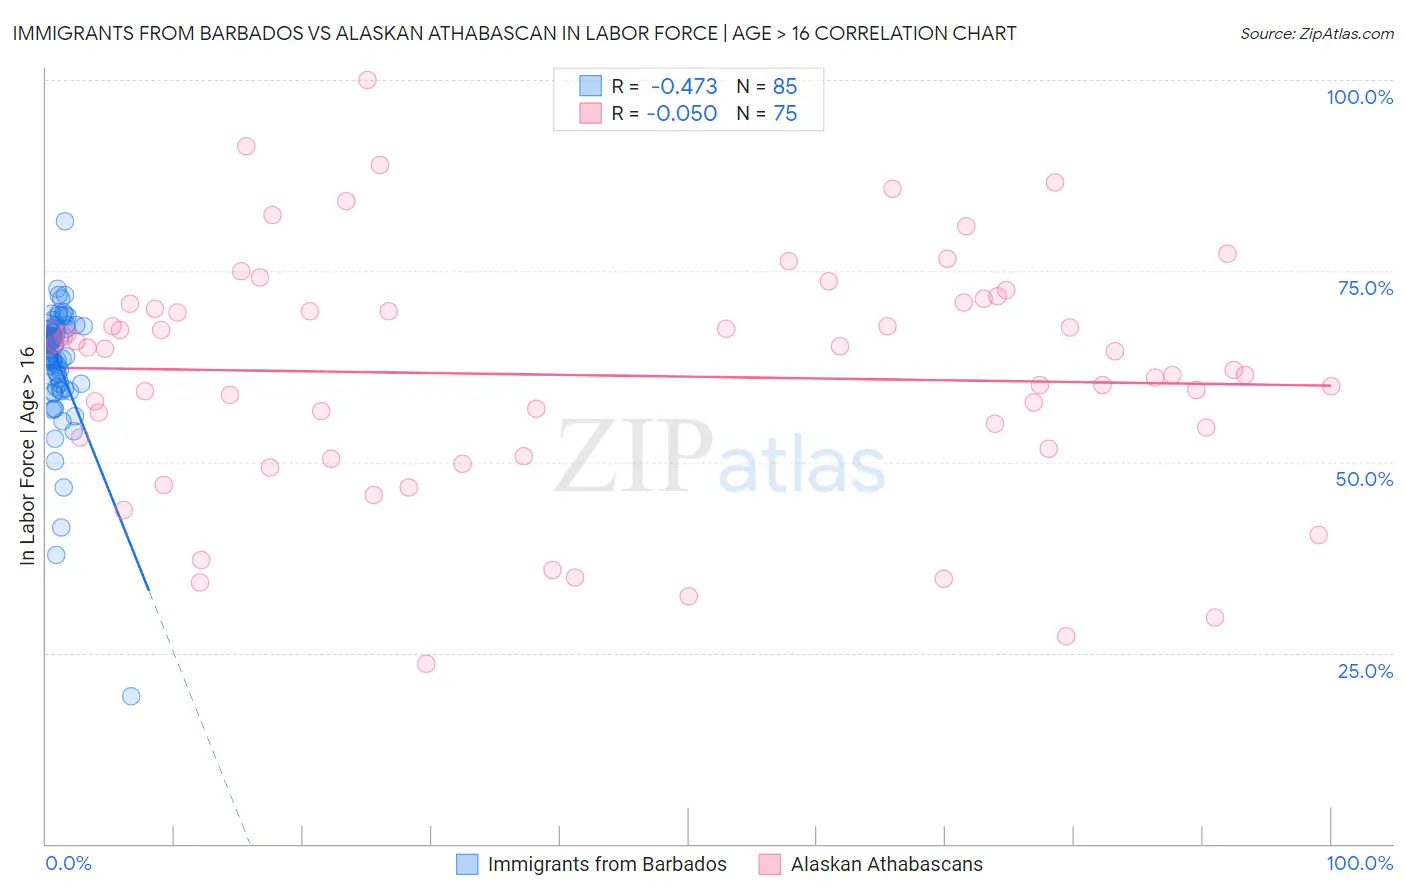
Immigrants from Barbados vs Alaskan Athabascan In Labor Force | Age > 16 Correlation Chart
The statistical analysis conducted on geographies consisting of 112,778,506 people shows a moderate negative correlation between the proportion of Immigrants from Barbados and labor force participation rate among population ages 16 and over in the United States with a correlation coefficient (R) of -0.473 and weighted average of 64.4%. Similarly, the statistical analysis conducted on geographies consisting of 45,821,503 people shows no correlation between the proportion of Alaskan Athabascans and labor force participation rate among population ages 16 and over in the United States with a correlation coefficient (R) of -0.050 and weighted average of 64.8%, a difference of 0.58%.
In Labor Force | Age > 16 Correlation Summary
| Measurement | Immigrants from Barbados | Alaskan Athabascan |
| Minimum | 19.3% | 23.6% |
| Maximum | 81.5% | 100.0% |
| Range | 62.2% | 76.4% |
| Mean | 63.2% | 61.3% |
| Median | 65.5% | 64.5% |
| Interquartile 25% (IQ1) | 60.6% | 51.8% |
| Interquartile 75% (IQ3) | 67.3% | 70.6% |
| Interquartile Range (IQR) | 6.7% | 18.8% |
| Standard Deviation (Sample) | 8.0% | 15.7% |
| Standard Deviation (Population) | 7.9% | 15.6% |
Similar Demographics by In Labor Force | Age > 16
Demographics Similar to Immigrants from Barbados by In Labor Force | Age > 16
In terms of in labor force | age > 16, the demographic groups most similar to Immigrants from Barbados are Swiss (64.4%, a difference of 0.010%), Immigrants from Caribbean (64.4%, a difference of 0.030%), German (64.4%, a difference of 0.030%), British West Indian (64.4%, a difference of 0.040%), and Portuguese (64.4%, a difference of 0.060%).
| Demographics | Rating | Rank | In Labor Force | Age > 16 |
| Immigrants | Dominica | 3.5 /100 | #241 | Tragic 64.5% |
| Immigrants | Netherlands | 3.4 /100 | #242 | Tragic 64.5% |
| Immigrants | Lebanon | 3.2 /100 | #243 | Tragic 64.5% |
| Tsimshian | 3.1 /100 | #244 | Tragic 64.5% |
| West Indians | 3.0 /100 | #245 | Tragic 64.5% |
| Immigrants | Caribbean | 2.3 /100 | #246 | Tragic 64.4% |
| Swiss | 2.1 /100 | #247 | Tragic 64.4% |
| Immigrants | Barbados | 2.1 /100 | #248 | Tragic 64.4% |
| Germans | 1.8 /100 | #249 | Tragic 64.4% |
| British West Indians | 1.8 /100 | #250 | Tragic 64.4% |
| Portuguese | 1.6 /100 | #251 | Tragic 64.4% |
| Immigrants | Dominican Republic | 1.5 /100 | #252 | Tragic 64.4% |
| Czechoslovakians | 1.4 /100 | #253 | Tragic 64.3% |
| Immigrants | Uzbekistan | 1.4 /100 | #254 | Tragic 64.3% |
| Hispanics or Latinos | 1.1 /100 | #255 | Tragic 64.3% |
Demographics Similar to Alaskan Athabascans by In Labor Force | Age > 16
In terms of in labor force | age > 16, the demographic groups most similar to Alaskan Athabascans are Maltese (64.8%, a difference of 0.0%), Fijian (64.8%, a difference of 0.010%), Immigrants from Denmark (64.8%, a difference of 0.020%), Estonian (64.8%, a difference of 0.020%), and Immigrants from Trinidad and Tobago (64.8%, a difference of 0.040%).
| Demographics | Rating | Rank | In Labor Force | Age > 16 |
| Jamaicans | 18.7 /100 | #205 | Poor 64.9% |
| Lithuanians | 17.4 /100 | #206 | Poor 64.8% |
| Immigrants | Latin America | 16.4 /100 | #207 | Poor 64.8% |
| Belizeans | 16.2 /100 | #208 | Poor 64.8% |
| Immigrants | Trinidad and Tobago | 15.6 /100 | #209 | Poor 64.8% |
| Immigrants | Denmark | 14.7 /100 | #210 | Poor 64.8% |
| Fijians | 14.1 /100 | #211 | Poor 64.8% |
| Alaskan Athabascans | 13.9 /100 | #212 | Poor 64.8% |
| Maltese | 13.8 /100 | #213 | Poor 64.8% |
| Estonians | 13.1 /100 | #214 | Poor 64.8% |
| Immigrants | Czechoslovakia | 12.3 /100 | #215 | Poor 64.8% |
| Belgians | 11.4 /100 | #216 | Poor 64.7% |
| U.S. Virgin Islanders | 11.3 /100 | #217 | Poor 64.7% |
| Alsatians | 10.7 /100 | #218 | Poor 64.7% |
| Immigrants | Central America | 10.5 /100 | #219 | Poor 64.7% |