Immigrants from Europe vs Yaqui In Labor Force | Age 45-54
COMPARE
Immigrants from Europe
Yaqui
In Labor Force | Age 45-54
In Labor Force | Age 45-54 Comparison
Immigrants from Europe
Yaqui
83.2%
IN LABOR FORCE | AGE 45-54
90.7/ 100
METRIC RATING
118th/ 347
METRIC RANK
78.9%
IN LABOR FORCE | AGE 45-54
0.0/ 100
METRIC RATING
320th/ 347
METRIC RANK
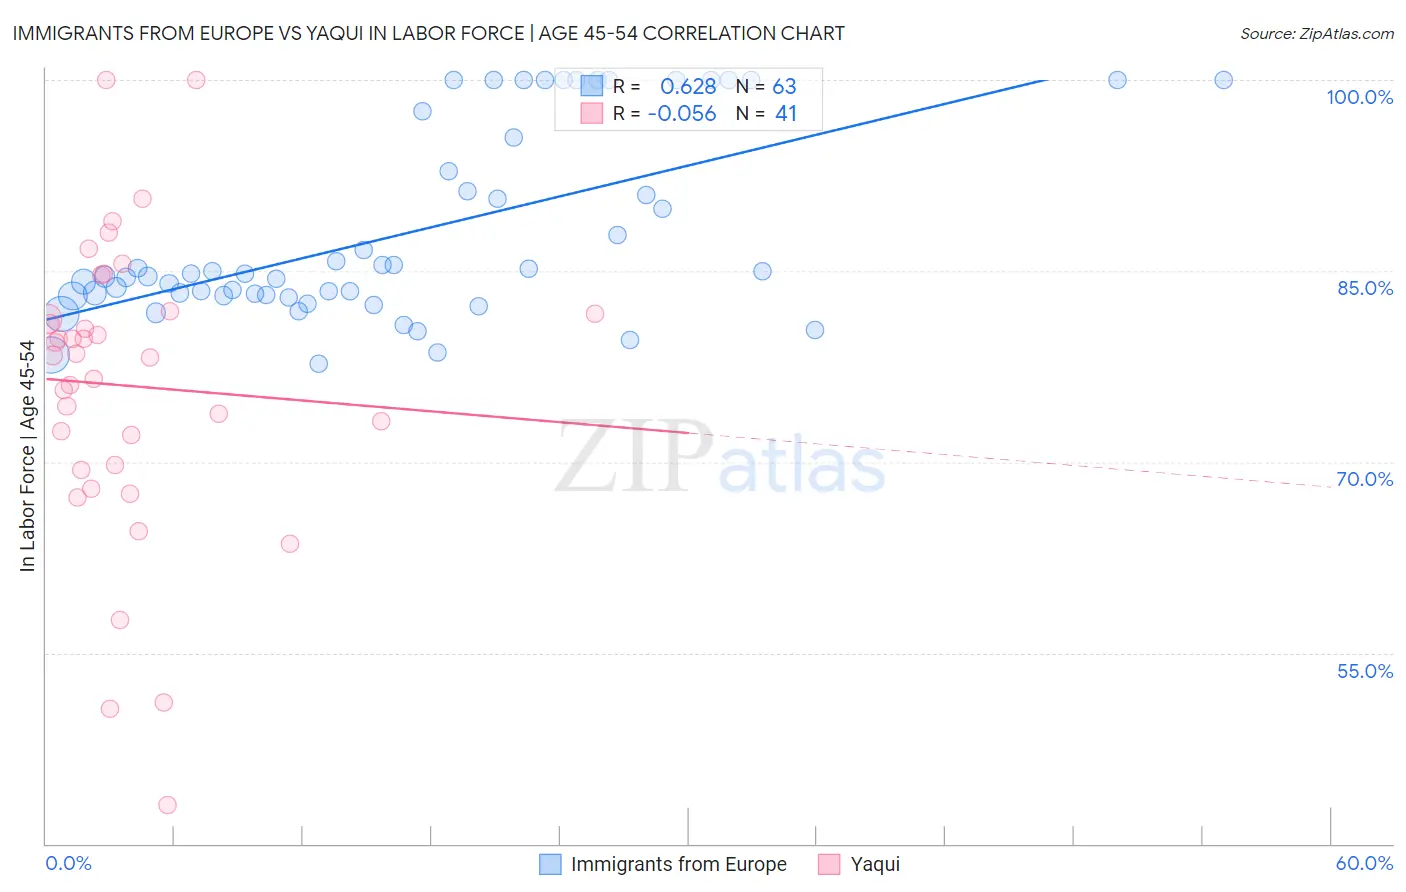
Immigrants from Europe vs Yaqui In Labor Force | Age 45-54 Correlation Chart
The statistical analysis conducted on geographies consisting of 546,802,439 people shows a significant positive correlation between the proportion of Immigrants from Europe and labor force participation rate among population between the ages 45 and 54 in the United States with a correlation coefficient (R) of 0.628 and weighted average of 83.2%. Similarly, the statistical analysis conducted on geographies consisting of 107,713,051 people shows a slight negative correlation between the proportion of Yaqui and labor force participation rate among population between the ages 45 and 54 in the United States with a correlation coefficient (R) of -0.056 and weighted average of 78.9%, a difference of 5.4%.
In Labor Force | Age 45-54 Correlation Summary
| Measurement | Immigrants from Europe | Yaqui |
| Minimum | 77.7% | 43.0% |
| Maximum | 100.0% | 100.0% |
| Range | 22.3% | 57.0% |
| Mean | 88.0% | 76.0% |
| Median | 84.7% | 78.4% |
| Interquartile 25% (IQ1) | 83.1% | 69.6% |
| Interquartile 75% (IQ3) | 95.5% | 81.7% |
| Interquartile Range (IQR) | 12.4% | 12.1% |
| Standard Deviation (Sample) | 7.4% | 11.8% |
| Standard Deviation (Population) | 7.3% | 11.7% |
Similar Demographics by In Labor Force | Age 45-54
Demographics Similar to Immigrants from Europe by In Labor Force | Age 45-54
In terms of in labor force | age 45-54, the demographic groups most similar to Immigrants from Europe are Immigrants from China (83.2%, a difference of 0.010%), Immigrants from Uruguay (83.2%, a difference of 0.010%), Immigrants from Russia (83.2%, a difference of 0.010%), Immigrants from Chile (83.2%, a difference of 0.020%), and Immigrants from Malaysia (83.2%, a difference of 0.020%).
| Demographics | Rating | Rank | In Labor Force | Age 45-54 |
| Immigrants | Italy | 92.5 /100 | #111 | Exceptional 83.2% |
| Immigrants | Afghanistan | 92.4 /100 | #112 | Exceptional 83.2% |
| Immigrants | Albania | 91.8 /100 | #113 | Exceptional 83.2% |
| Assyrians/Chaldeans/Syriacs | 91.7 /100 | #114 | Exceptional 83.2% |
| Immigrants | Chile | 91.6 /100 | #115 | Exceptional 83.2% |
| Immigrants | Malaysia | 91.4 /100 | #116 | Exceptional 83.2% |
| Immigrants | China | 90.9 /100 | #117 | Exceptional 83.2% |
| Immigrants | Europe | 90.7 /100 | #118 | Exceptional 83.2% |
| Immigrants | Uruguay | 90.2 /100 | #119 | Exceptional 83.2% |
| Immigrants | Russia | 90.1 /100 | #120 | Exceptional 83.2% |
| Uruguayans | 89.4 /100 | #121 | Excellent 83.1% |
| Immigrants | Vietnam | 88.9 /100 | #122 | Excellent 83.1% |
| Tongans | 88.2 /100 | #123 | Excellent 83.1% |
| Bermudans | 88.0 /100 | #124 | Excellent 83.1% |
| Immigrants | Iran | 87.2 /100 | #125 | Excellent 83.1% |
Demographics Similar to Yaqui by In Labor Force | Age 45-54
In terms of in labor force | age 45-54, the demographic groups most similar to Yaqui are Cherokee (79.0%, a difference of 0.10%), Chickasaw (79.0%, a difference of 0.21%), Yup'ik (78.6%, a difference of 0.30%), Comanche (79.2%, a difference of 0.38%), and Shoshone (79.3%, a difference of 0.52%).
| Demographics | Rating | Rank | In Labor Force | Age 45-54 |
| Colville | 0.0 /100 | #313 | Tragic 79.5% |
| Ottawa | 0.0 /100 | #314 | Tragic 79.5% |
| Blacks/African Americans | 0.0 /100 | #315 | Tragic 79.3% |
| Shoshone | 0.0 /100 | #316 | Tragic 79.3% |
| Comanche | 0.0 /100 | #317 | Tragic 79.2% |
| Chickasaw | 0.0 /100 | #318 | Tragic 79.0% |
| Cherokee | 0.0 /100 | #319 | Tragic 79.0% |
| Yaqui | 0.0 /100 | #320 | Tragic 78.9% |
| Yup'ik | 0.0 /100 | #321 | Tragic 78.6% |
| Crow | 0.0 /100 | #322 | Tragic 78.3% |
| Kiowa | 0.0 /100 | #323 | Tragic 78.3% |
| Dutch West Indians | 0.0 /100 | #324 | Tragic 78.2% |
| Choctaw | 0.0 /100 | #325 | Tragic 78.2% |
| Seminole | 0.0 /100 | #326 | Tragic 78.1% |
| Cajuns | 0.0 /100 | #327 | Tragic 78.1% |