Immigrants from Denmark vs Welsh In Labor Force | Age 16-19

COMPARE

Immigrants from Denmark
Race
Ancestry
AfghanAfricanAlaska NativeAlaskan AthabascanAlbanianAleutAlsatianAmericanApacheArabArapahoArgentineanArmenianAssyrian/Chaldean/SyriacAustralianAustrianBahamianBangladeshiBarbadianBasqueBelgianBelizeanBermudanBhutaneseBlackfeetBolivianBrazilianBritishBritish West IndianBulgarianBurmeseCajunCambodianCanadianCape VerdeanCarpatho RusynCelticCentral AmericanCentral American IndianCherokeeCheyenneChickasawChileanChineseChippewaChoctawColombianColvilleComancheCosta RicanCreeCreekCroatianCrowCubanCypriotCzechCzechoslovakianDanishDelawareDominicanDutchDutch West IndianEastern EuropeanEcuadorianEgyptianEnglishEstonianEthiopianEuropeanFijianFilipinoFinnishFrenchFrench American IndianFrench CanadianGermanGerman RussianGhanaianGreekGuamanian/ChamorroGuatemalanGuyaneseHaitianHmongHonduranHopiHoumaHungarianIcelanderIndian (Asian)IndonesianInupiatIranianIraqiIrishIroquoisIsraeliItalianJamaicanJapaneseJordanianKenyanKiowaKoreanLaotianLatvianLebaneseLiberianLithuanianLumbeeLuxembourgerMacedonianMalaysianMalteseMarshalleseMenomineeMexicanMexican American IndianMongolianMoroccanNative HawaiianNavajoNepaleseNew ZealanderNicaraguanNigerianNorthern EuropeanNorwegianOkinawanOsageOttawaPaiutePakistaniPalestinianPanamanianParaguayanPennsylvania GermanPeruvianPimaPolishPortuguesePotawatomiPuebloPuerto RicanPuget Sound SalishRomanianRussianSalvadoranSamoanScandinavianScotch-IrishScottishSeminoleSenegaleseSerbianShoshoneSierra LeoneanSiouxSlavicSlovakSloveneSomaliSouth AfricanSouth AmericanSouth American IndianSoviet UnionSpaniardSpanishSpanish AmericanSpanish American IndianSri LankanSubsaharan AfricanSudaneseSwedishSwissSyrianTaiwaneseThaiTlingit-HaidaTohono O'OdhamTonganTrinidadian and TobagonianTsimshianTurkishU.S. Virgin IslanderUgandanUkrainianUruguayanUteVenezuelanVietnameseWest IndianYakamaYaquiYugoslavianYumanYup'ikZimbabwean
Immigration
NonimmigrantsImmigrantsAfghanistanAfricaAlbaniaArgentinaArmeniaAsiaAustraliaAustriaBahamasBangladeshBarbadosBelarusBelgiumBelizeBoliviaBosnia and HerzegovinaBrazilBulgariaBurma/MyanmarCabo VerdeCambodiaCameroonCanadaCaribbeanCentral AmericaChileChinaColombiaCongoCosta RicaCroatiaCubaCzechoslovakiaDenmarkDominicaDominican RepublicEastern AfricaEastern AsiaEastern EuropeEcuadorEgyptEl SalvadorEnglandEritreaEthiopiaEuropeFijiFranceGermanyGhanaGreeceGrenadaGuatemalaGuyanaHaitiHondurasHong KongHungaryIndiaIndonesiaIranIraqIrelandIsraelItalyJamaicaJapanJordanKazakhstanKenyaKoreaKuwaitLaosLatin AmericaLatviaLebanonLiberiaLithuaniaMalaysiaMexicoMicronesiaMiddle AfricaMoldovaMoroccoNepalNetherlandsNicaraguaNigeriaNorth AmericaNorth MacedoniaNorthern AfricaNorthern EuropeNorwayOceaniaPakistanPanamaPeruPhilippinesPolandPortugalRomaniaRussiaSaudi ArabiaScotlandSenegalSerbiaSierra LeoneSingaporeSomaliaSouth AfricaSouth AmericaSouth Central AsiaSouth Eastern AsiaSouthern EuropeSpainSri LankaSt. Vincent and the GrenadinesSudanSwedenSwitzerlandSyriaTaiwanThailandTrinidad and TobagoTurkeyUgandaUkraineUruguayUzbekistanVenezuelaVietnamWest IndiesWestern AfricaWestern AsiaWestern EuropeYemenZaireZimbabweAzores
Welsh
Race
Ancestry
AfghanAfricanAlaska NativeAlaskan AthabascanAlbanianAleutAlsatianAmericanApacheArabArapahoArgentineanArmenianAssyrian/Chaldean/SyriacAustralianAustrianBahamianBangladeshiBarbadianBasqueBelgianBelizeanBermudanBhutaneseBlackfeetBolivianBrazilianBritishBritish West IndianBulgarianBurmeseCajunCambodianCanadianCape VerdeanCarpatho RusynCelticCentral AmericanCentral American IndianCherokeeCheyenneChickasawChileanChineseChippewaChoctawColombianColvilleComancheCosta RicanCreeCreekCroatianCrowCubanCypriotCzechCzechoslovakianDanishDelawareDominicanDutchDutch West IndianEastern EuropeanEcuadorianEgyptianEnglishEstonianEthiopianEuropeanFijianFilipinoFinnishFrenchFrench American IndianFrench CanadianGermanGerman RussianGhanaianGreekGuamanian/ChamorroGuatemalanGuyaneseHaitianHmongHonduranHopiHoumaHungarianIcelanderIndian (Asian)IndonesianInupiatIranianIraqiIrishIroquoisIsraeliItalianJamaicanJapaneseJordanianKenyanKiowaKoreanLaotianLatvianLebaneseLiberianLithuanianLumbeeLuxembourgerMacedonianMalaysianMalteseMarshalleseMenomineeMexicanMexican American IndianMongolianMoroccanNative HawaiianNavajoNepaleseNew ZealanderNicaraguanNigerianNorthern EuropeanNorwegianOkinawanOsageOttawaPaiutePakistaniPalestinianPanamanianParaguayanPennsylvania GermanPeruvianPimaPolishPortuguesePotawatomiPuebloPuerto RicanPuget Sound SalishRomanianRussianSalvadoranSamoanScandinavianScotch-IrishScottishSeminoleSenegaleseSerbianShoshoneSierra LeoneanSiouxSlavicSlovakSloveneSomaliSouth AfricanSouth AmericanSouth American IndianSoviet UnionSpaniardSpanishSpanish AmericanSpanish American IndianSri LankanSubsaharan AfricanSudaneseSwedishSwissSyrianTaiwaneseThaiTlingit-HaidaTohono O'OdhamTonganTrinidadian and TobagonianTsimshianTurkishU.S. Virgin IslanderUgandanUkrainianUruguayanUteVenezuelanVietnameseWelshWest IndianYakamaYaquiYugoslavianYumanYup'ikZimbabwean
Immigration
NonimmigrantsImmigrantsAfghanistanAfricaAlbaniaArgentinaArmeniaAsiaAustraliaAustriaBahamasBangladeshBarbadosBelarusBelgiumBelizeBoliviaBosnia and HerzegovinaBrazilBulgariaBurma/MyanmarCabo VerdeCambodiaCameroonCanadaCaribbeanCentral AmericaChileChinaColombiaCongoCosta RicaCroatiaCubaCzechoslovakiaDominicaDominican RepublicEastern AfricaEastern AsiaEastern EuropeEcuadorEgyptEl SalvadorEnglandEritreaEthiopiaEuropeFijiFranceGermanyGhanaGreeceGrenadaGuatemalaGuyanaHaitiHondurasHong KongHungaryIndiaIndonesiaIranIraqIrelandIsraelItalyJamaicaJapanJordanKazakhstanKenyaKoreaKuwaitLaosLatin AmericaLatviaLebanonLiberiaLithuaniaMalaysiaMexicoMicronesiaMiddle AfricaMoldovaMoroccoNepalNetherlandsNicaraguaNigeriaNorth AmericaNorth MacedoniaNorthern AfricaNorthern EuropeNorwayOceaniaPakistanPanamaPeruPhilippinesPolandPortugalRomaniaRussiaSaudi ArabiaScotlandSenegalSerbiaSierra LeoneSingaporeSomaliaSouth AfricaSouth AmericaSouth Central AsiaSouth Eastern AsiaSouthern EuropeSpainSri LankaSt. Vincent and the GrenadinesSudanSwedenSwitzerlandSyriaTaiwanThailandTrinidad and TobagoTurkeyUgandaUkraineUruguayUzbekistanVenezuelaVietnamWest IndiesWestern AfricaWestern AsiaWestern EuropeYemenZaireZimbabweAzores
In Labor Force | Age 16-19
Income
Poverty
Unemployment
Labor Participation
Family Structure
Vehicle Availability
Education Level
Disability

In Labor Force | Age 16-19 Comparison

Immigrants from Denmark

Welsh

Fair
Exceptional
36.1%
IN LABOR FORCE | AGE 16-19
25.0/ 100
METRIC RATING
193rd/ 347
METRIC RANK
42.3%
IN LABOR FORCE | AGE 16-19
100.0/ 100
METRIC RATING
27th/ 347
METRIC RANK

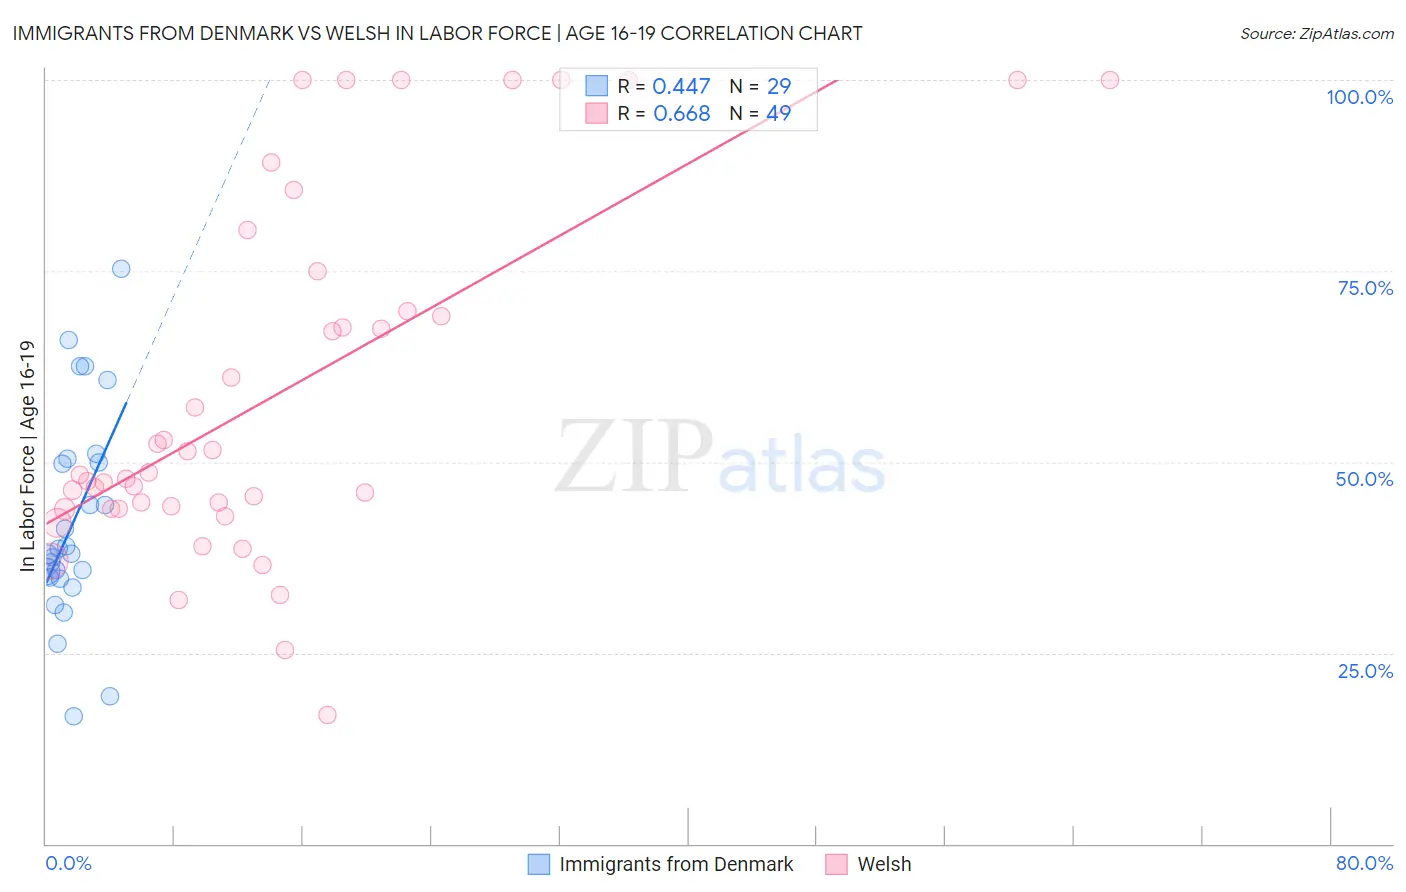
Immigrants from Denmark vs Welsh In Labor Force | Age 16-19 Correlation Chart

The statistical analysis conducted on geographies consisting of 136,287,705 people shows a moderate positive correlation between the proportion of Immigrants from Denmark and labor force participation rate among population between the ages 16 and 19 in the United States with a correlation coefficient (R) of 0.447 and weighted average of 36.1%. Similarly, the statistical analysis conducted on geographies consisting of 526,098,531 people shows a significant positive correlation between the proportion of Welsh and labor force participation rate among population between the ages 16 and 19 in the United States with a correlation coefficient (R) of 0.668 and weighted average of 42.3%, a difference of 17.2%.
Immigrants from Denmark vs Welsh In Labor Force | Age 16-19

In Labor Force | Age 16-19 Correlation Summary

MeasurementImmigrants from DenmarkWelsh
Minimum16.7%16.8%
Maximum75.3%100.0%
Range58.6%83.2%
Mean42.1%58.7%
Median38.0%48.3%
Interquartile 25% (IQ1)34.8%43.9%
Interquartile 75% (IQ3)50.2%72.3%
Interquartile Range (IQR)15.4%28.4%
Standard Deviation (Sample)13.6%23.2%
Standard Deviation (Population)13.4%23.0%

Similar Demographics by In Labor Force | Age 16-19

Demographics Similar to Immigrants from Denmark by In Labor Force | Age 16-19

In terms of in labor force | age 16-19, the demographic groups most similar to Immigrants from Denmark are Nigerian (36.1%, a difference of 0.030%), Afghan (36.1%, a difference of 0.040%), Bolivian (36.0%, a difference of 0.12%), Immigrants from Croatia (36.1%, a difference of 0.17%), and Panamanian (36.1%, a difference of 0.23%).
DemographicsRating | RankIn Labor Force | Age 16-19
Immigrants | Romania
34.0
/100
|
#186
Fair
36.3%
Immigrants | Afghanistan
34.0
/100
|
#187
Fair
36.3%
Immigrants | Europe
31.8
/100
|
#188
Fair
36.2%
Immigrants | Hungary
28.8
/100
|
#189
Fair
36.2%
Panamanians
28.6
/100
|
#190
Fair
36.1%
Immigrants | Croatia
27.5
/100
|
#191
Fair
36.1%
Afghans
25.7
/100
|
#192
Fair
36.1%
Immigrants | Denmark
25.0
/100
|
#193
Fair
36.1%
Nigerians
24.6
/100
|
#194
Fair
36.1%
Bolivians
23.3
/100
|
#195
Fair
36.0%
Mexican American Indians
21.1
/100
|
#196
Fair
36.0%
Immigrants | Serbia
21.0
/100
|
#197
Fair
36.0%
Immigrants | Northern Africa
19.9
/100
|
#198
Poor
35.9%
Immigrants | Norway
19.8
/100
|
#199
Poor
35.9%
Immigrants | Sweden
18.8
/100
|
#200
Poor
35.9%

Demographics Similar to Welsh by In Labor Force | Age 16-19

In terms of in labor force | age 16-19, the demographic groups most similar to Welsh are English (42.4%, a difference of 0.28%), Polish (42.1%, a difference of 0.29%), French (42.1%, a difference of 0.35%), German Russian (42.4%, a difference of 0.40%), and Bangladeshi (42.5%, a difference of 0.48%).
DemographicsRating | RankIn Labor Force | Age 16-19
Swiss
100.0
/100
|
#20
Exceptional
43.3%
Ottawa
100.0
/100
|
#21
Exceptional
43.0%
Sudanese
100.0
/100
|
#22
Exceptional
42.9%
Slovaks
100.0
/100
|
#23
Exceptional
42.6%
Bangladeshis
100.0
/100
|
#24
Exceptional
42.5%
German Russians
100.0
/100
|
#25
Exceptional
42.4%
English
100.0
/100
|
#26
Exceptional
42.4%
Welsh
100.0
/100
|
#27
Exceptional
42.3%
Poles
100.0
/100
|
#28
Exceptional
42.1%
French
100.0
/100
|
#29
Exceptional
42.1%
Scottish
100.0
/100
|
#30
Exceptional
42.0%
Irish
100.0
/100
|
#31
Exceptional
42.0%
Czechoslovakians
100.0
/100
|
#32
Exceptional
41.9%
Liberians
100.0
/100
|
#33
Exceptional
41.8%
Immigrants | Bosnia and Herzegovina
100.0
/100
|
#34
Exceptional
41.8%