Immigrants from Northern Africa vs Welsh In Labor Force | Age 16-19
COMPARE
Immigrants from Northern Africa
Welsh
In Labor Force | Age 16-19
In Labor Force | Age 16-19 Comparison
Immigrants from Northern Africa
Welsh
35.9%
IN LABOR FORCE | AGE 16-19
19.9/ 100
METRIC RATING
198th/ 347
METRIC RANK
42.3%
IN LABOR FORCE | AGE 16-19
100.0/ 100
METRIC RATING
27th/ 347
METRIC RANK
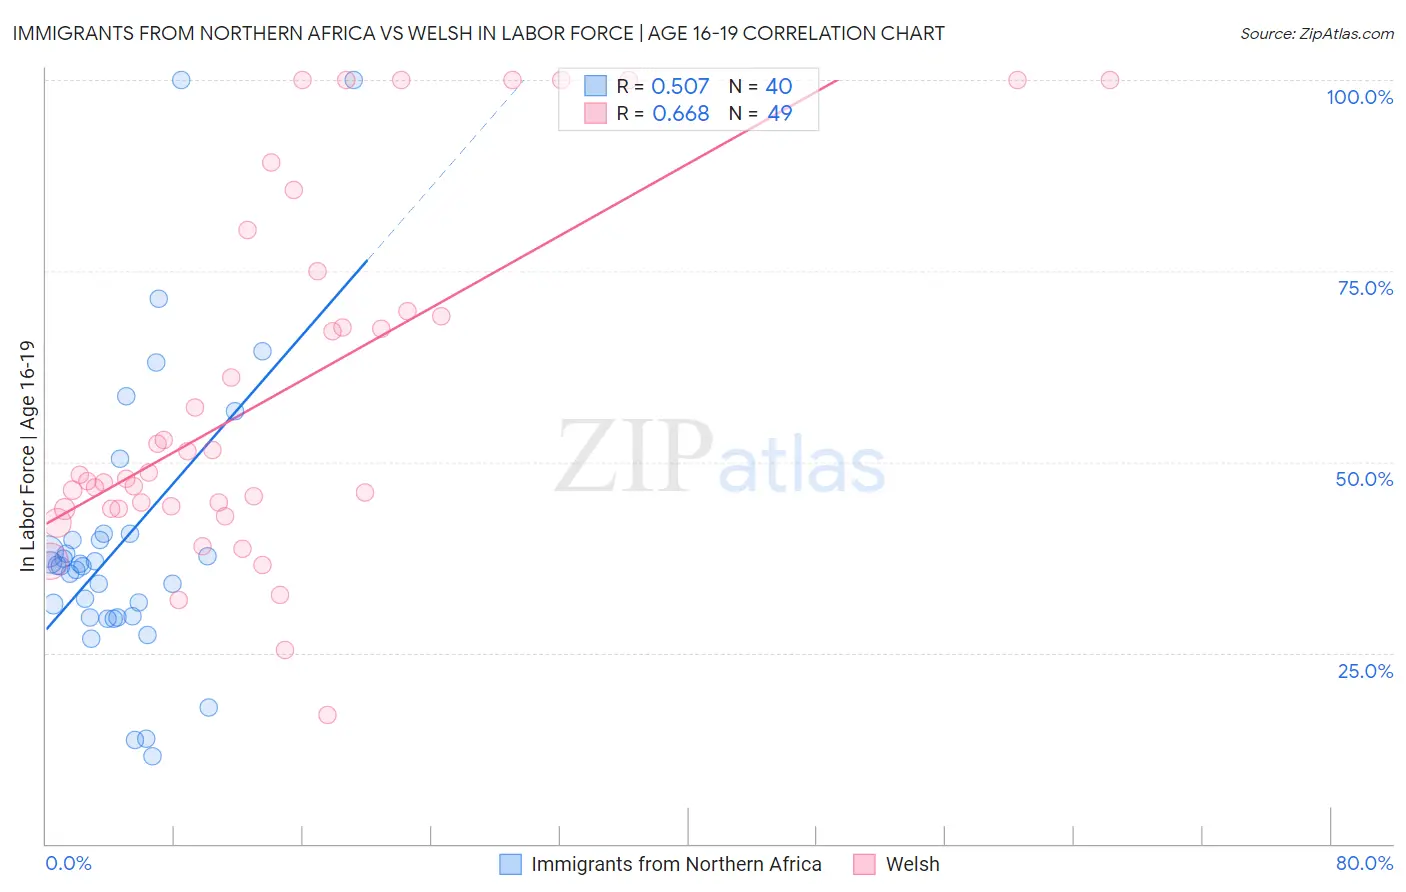
Immigrants from Northern Africa vs Welsh In Labor Force | Age 16-19 Correlation Chart
The statistical analysis conducted on geographies consisting of 320,851,402 people shows a substantial positive correlation between the proportion of Immigrants from Northern Africa and labor force participation rate among population between the ages 16 and 19 in the United States with a correlation coefficient (R) of 0.507 and weighted average of 35.9%. Similarly, the statistical analysis conducted on geographies consisting of 526,098,531 people shows a significant positive correlation between the proportion of Welsh and labor force participation rate among population between the ages 16 and 19 in the United States with a correlation coefficient (R) of 0.668 and weighted average of 42.3%, a difference of 17.6%.
In Labor Force | Age 16-19 Correlation Summary
| Measurement | Immigrants from Northern Africa | Welsh |
| Minimum | 11.4% | 16.8% |
| Maximum | 100.0% | 100.0% |
| Range | 88.6% | 83.2% |
| Mean | 39.7% | 58.7% |
| Median | 36.4% | 48.3% |
| Interquartile 25% (IQ1) | 29.8% | 43.9% |
| Interquartile 75% (IQ3) | 40.1% | 72.3% |
| Interquartile Range (IQR) | 10.4% | 28.4% |
| Standard Deviation (Sample) | 19.0% | 23.2% |
| Standard Deviation (Population) | 18.7% | 23.0% |
Similar Demographics by In Labor Force | Age 16-19
Demographics Similar to Immigrants from Northern Africa by In Labor Force | Age 16-19
In terms of in labor force | age 16-19, the demographic groups most similar to Immigrants from Northern Africa are Immigrants from Norway (35.9%, a difference of 0.010%), Immigrants from Serbia (36.0%, a difference of 0.080%), Mexican American Indian (36.0%, a difference of 0.090%), Immigrants from Sweden (35.9%, a difference of 0.090%), and Alsatian (35.9%, a difference of 0.21%).
| Demographics | Rating | Rank | In Labor Force | Age 16-19 |
| Immigrants | Croatia | 27.5 /100 | #191 | Fair 36.1% |
| Afghans | 25.7 /100 | #192 | Fair 36.1% |
| Immigrants | Denmark | 25.0 /100 | #193 | Fair 36.1% |
| Nigerians | 24.6 /100 | #194 | Fair 36.1% |
| Bolivians | 23.3 /100 | #195 | Fair 36.0% |
| Mexican American Indians | 21.1 /100 | #196 | Fair 36.0% |
| Immigrants | Serbia | 21.0 /100 | #197 | Fair 36.0% |
| Immigrants | Northern Africa | 19.9 /100 | #198 | Poor 35.9% |
| Immigrants | Norway | 19.8 /100 | #199 | Poor 35.9% |
| Immigrants | Sweden | 18.8 /100 | #200 | Poor 35.9% |
| Alsatians | 17.5 /100 | #201 | Poor 35.9% |
| Senegalese | 17.4 /100 | #202 | Poor 35.9% |
| Immigrants | Nigeria | 16.8 /100 | #203 | Poor 35.8% |
| Immigrants | Albania | 15.0 /100 | #204 | Poor 35.8% |
| South American Indians | 14.6 /100 | #205 | Poor 35.8% |
Demographics Similar to Welsh by In Labor Force | Age 16-19
In terms of in labor force | age 16-19, the demographic groups most similar to Welsh are English (42.4%, a difference of 0.28%), Polish (42.1%, a difference of 0.29%), French (42.1%, a difference of 0.35%), German Russian (42.4%, a difference of 0.40%), and Bangladeshi (42.5%, a difference of 0.48%).
| Demographics | Rating | Rank | In Labor Force | Age 16-19 |
| Swiss | 100.0 /100 | #20 | Exceptional 43.3% |
| Ottawa | 100.0 /100 | #21 | Exceptional 43.0% |
| Sudanese | 100.0 /100 | #22 | Exceptional 42.9% |
| Slovaks | 100.0 /100 | #23 | Exceptional 42.6% |
| Bangladeshis | 100.0 /100 | #24 | Exceptional 42.5% |
| German Russians | 100.0 /100 | #25 | Exceptional 42.4% |
| English | 100.0 /100 | #26 | Exceptional 42.4% |
| Welsh | 100.0 /100 | #27 | Exceptional 42.3% |
| Poles | 100.0 /100 | #28 | Exceptional 42.1% |
| French | 100.0 /100 | #29 | Exceptional 42.1% |
| Scottish | 100.0 /100 | #30 | Exceptional 42.0% |
| Irish | 100.0 /100 | #31 | Exceptional 42.0% |
| Czechoslovakians | 100.0 /100 | #32 | Exceptional 41.9% |
| Liberians | 100.0 /100 | #33 | Exceptional 41.8% |
| Immigrants | Bosnia and Herzegovina | 100.0 /100 | #34 | Exceptional 41.8% |