Bahamian vs Immigrants from Netherlands In Labor Force | Age 16-19
COMPARE
Bahamian
Immigrants from Netherlands
In Labor Force | Age 16-19
In Labor Force | Age 16-19 Comparison
Bahamians
Immigrants from Netherlands
34.6%
IN LABOR FORCE | AGE 16-19
1.4/ 100
METRIC RATING
254th/ 347
METRIC RANK
37.8%
IN LABOR FORCE | AGE 16-19
93.7/ 100
METRIC RATING
134th/ 347
METRIC RANK
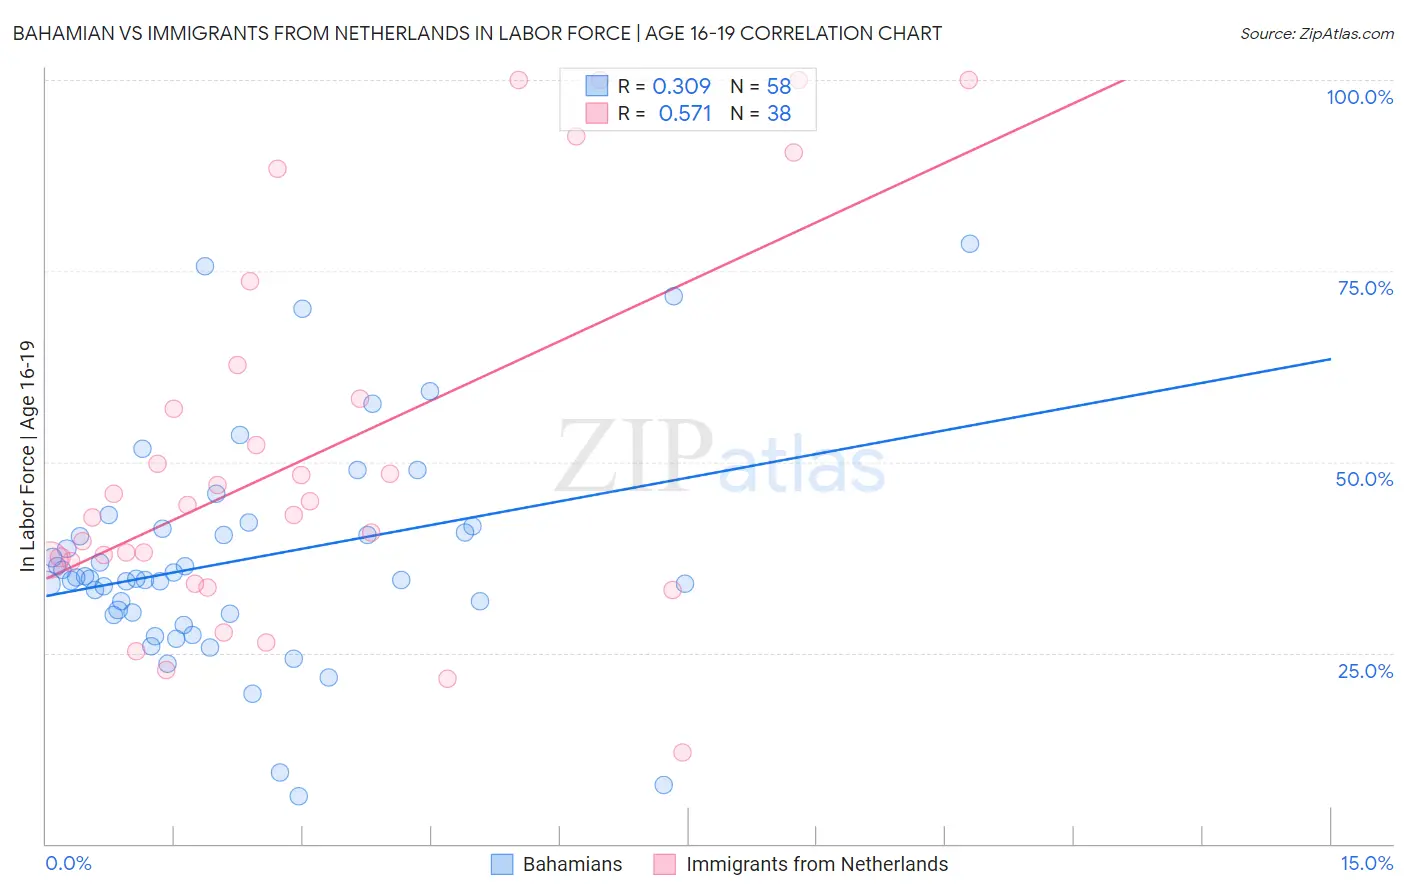
Bahamian vs Immigrants from Netherlands In Labor Force | Age 16-19 Correlation Chart
The statistical analysis conducted on geographies consisting of 112,651,679 people shows a mild positive correlation between the proportion of Bahamians and labor force participation rate among population between the ages 16 and 19 in the United States with a correlation coefficient (R) of 0.309 and weighted average of 34.6%. Similarly, the statistical analysis conducted on geographies consisting of 237,512,378 people shows a substantial positive correlation between the proportion of Immigrants from Netherlands and labor force participation rate among population between the ages 16 and 19 in the United States with a correlation coefficient (R) of 0.571 and weighted average of 37.8%, a difference of 9.2%.
In Labor Force | Age 16-19 Correlation Summary
| Measurement | Bahamian | Immigrants from Netherlands |
| Minimum | 6.3% | 12.0% |
| Maximum | 78.5% | 100.0% |
| Range | 72.2% | 88.0% |
| Mean | 37.1% | 50.8% |
| Median | 34.6% | 43.7% |
| Interquartile 25% (IQ1) | 30.1% | 36.9% |
| Interquartile 75% (IQ3) | 41.2% | 58.3% |
| Interquartile Range (IQR) | 11.1% | 21.4% |
| Standard Deviation (Sample) | 14.4% | 24.7% |
| Standard Deviation (Population) | 14.3% | 24.3% |
Similar Demographics by In Labor Force | Age 16-19
Demographics Similar to Bahamians by In Labor Force | Age 16-19
In terms of in labor force | age 16-19, the demographic groups most similar to Bahamians are Peruvian (34.6%, a difference of 0.040%), Immigrants from Japan (34.7%, a difference of 0.12%), Immigrants from South Central Asia (34.6%, a difference of 0.15%), Immigrants from Egypt (34.6%, a difference of 0.15%), and Thai (34.6%, a difference of 0.16%).
| Demographics | Rating | Rank | In Labor Force | Age 16-19 |
| Laotians | 2.4 /100 | #247 | Tragic 34.9% |
| Central Americans | 2.2 /100 | #248 | Tragic 34.8% |
| Immigrants | Ukraine | 2.2 /100 | #249 | Tragic 34.8% |
| Immigrants | Pakistan | 2.0 /100 | #250 | Tragic 34.8% |
| Immigrants | Western Asia | 2.0 /100 | #251 | Tragic 34.8% |
| Immigrants | Chile | 2.0 /100 | #252 | Tragic 34.8% |
| Immigrants | Japan | 1.5 /100 | #253 | Tragic 34.7% |
| Bahamians | 1.4 /100 | #254 | Tragic 34.6% |
| Peruvians | 1.4 /100 | #255 | Tragic 34.6% |
| Immigrants | South Central Asia | 1.3 /100 | #256 | Tragic 34.6% |
| Immigrants | Egypt | 1.2 /100 | #257 | Tragic 34.6% |
| Thais | 1.2 /100 | #258 | Tragic 34.6% |
| Immigrants | Immigrants | 1.2 /100 | #259 | Tragic 34.6% |
| Egyptians | 1.2 /100 | #260 | Tragic 34.5% |
| Salvadorans | 1.1 /100 | #261 | Tragic 34.5% |
Demographics Similar to Immigrants from Netherlands by In Labor Force | Age 16-19
In terms of in labor force | age 16-19, the demographic groups most similar to Immigrants from Netherlands are Macedonian (37.8%, a difference of 0.060%), Australian (37.8%, a difference of 0.090%), Cajun (37.8%, a difference of 0.090%), Cheyenne (37.9%, a difference of 0.21%), and Immigrants from Oceania (37.9%, a difference of 0.23%).
| Demographics | Rating | Rank | In Labor Force | Age 16-19 |
| Choctaw | 95.6 /100 | #127 | Exceptional 38.0% |
| New Zealanders | 95.6 /100 | #128 | Exceptional 38.0% |
| Spaniards | 95.5 /100 | #129 | Exceptional 38.0% |
| Immigrants | Zimbabwe | 95.4 /100 | #130 | Exceptional 38.0% |
| Immigrants | Austria | 95.0 /100 | #131 | Exceptional 37.9% |
| Immigrants | Oceania | 94.7 /100 | #132 | Exceptional 37.9% |
| Cheyenne | 94.6 /100 | #133 | Exceptional 37.9% |
| Immigrants | Netherlands | 93.7 /100 | #134 | Exceptional 37.8% |
| Macedonians | 93.4 /100 | #135 | Exceptional 37.8% |
| Australians | 93.2 /100 | #136 | Exceptional 37.8% |
| Cajuns | 93.2 /100 | #137 | Exceptional 37.8% |
| Comanche | 91.9 /100 | #138 | Exceptional 37.7% |
| Immigrants | Moldova | 91.9 /100 | #139 | Exceptional 37.7% |
| Estonians | 91.7 /100 | #140 | Exceptional 37.7% |
| Syrians | 90.7 /100 | #141 | Exceptional 37.6% |