African vs Immigrants from Egypt In Labor Force | Age 16-19
COMPARE
African
Immigrants from Egypt
In Labor Force | Age 16-19
In Labor Force | Age 16-19 Comparison
Africans
Immigrants from Egypt
38.0%
IN LABOR FORCE | AGE 16-19
95.6/ 100
METRIC RATING
126th/ 347
METRIC RANK
34.6%
IN LABOR FORCE | AGE 16-19
1.2/ 100
METRIC RATING
257th/ 347
METRIC RANK
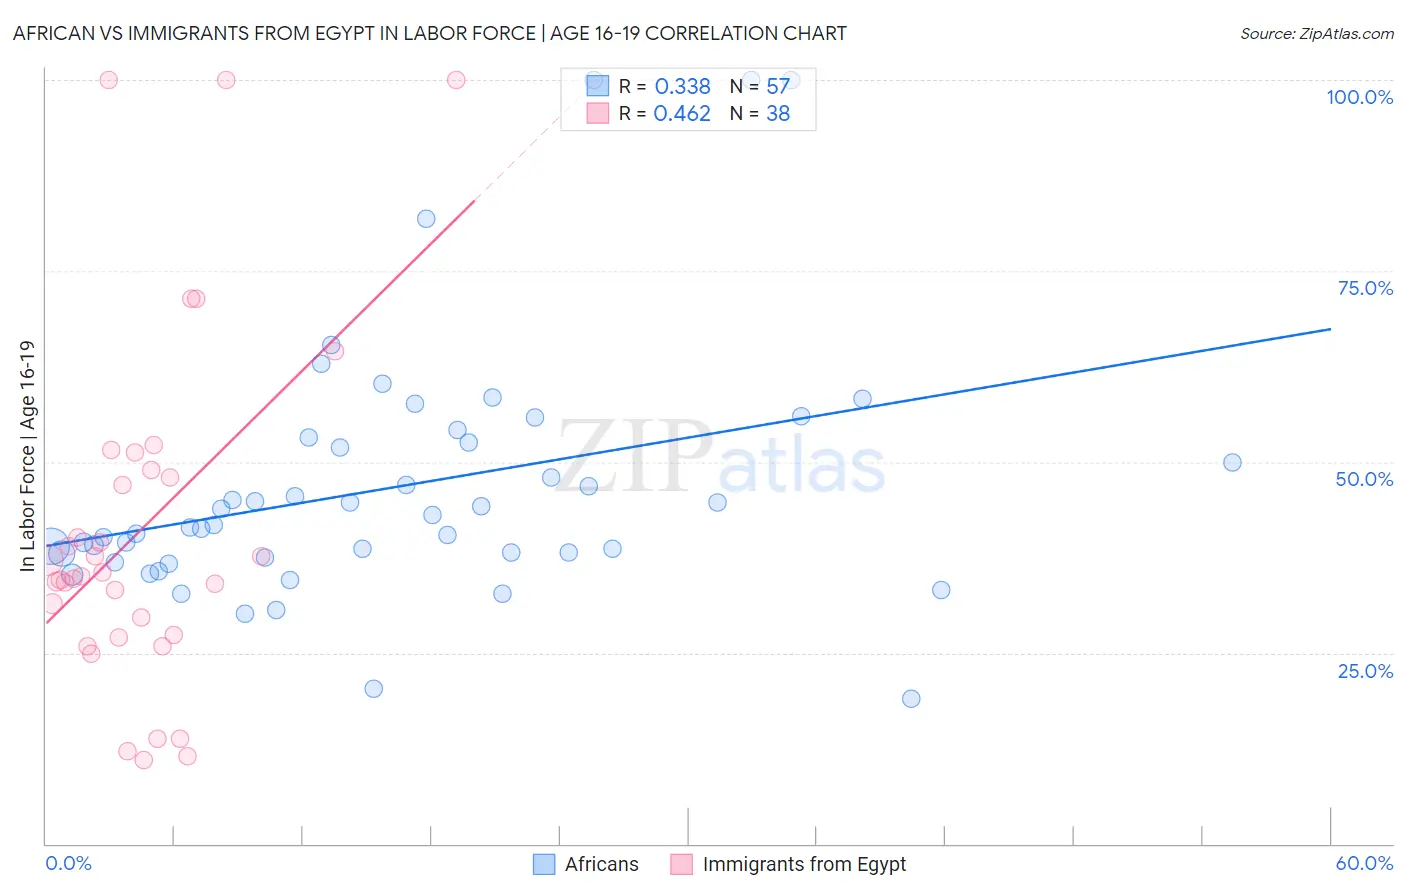
African vs Immigrants from Egypt In Labor Force | Age 16-19 Correlation Chart
The statistical analysis conducted on geographies consisting of 469,169,744 people shows a mild positive correlation between the proportion of Africans and labor force participation rate among population between the ages 16 and 19 in the United States with a correlation coefficient (R) of 0.338 and weighted average of 38.0%. Similarly, the statistical analysis conducted on geographies consisting of 245,278,440 people shows a moderate positive correlation between the proportion of Immigrants from Egypt and labor force participation rate among population between the ages 16 and 19 in the United States with a correlation coefficient (R) of 0.462 and weighted average of 34.6%, a difference of 9.9%.
In Labor Force | Age 16-19 Correlation Summary
| Measurement | African | Immigrants from Egypt |
| Minimum | 19.0% | 11.0% |
| Maximum | 100.0% | 100.0% |
| Range | 81.0% | 89.0% |
| Mean | 46.7% | 41.2% |
| Median | 41.8% | 35.3% |
| Interquartile 25% (IQ1) | 37.8% | 27.4% |
| Interquartile 75% (IQ3) | 52.9% | 48.9% |
| Interquartile Range (IQR) | 15.1% | 21.5% |
| Standard Deviation (Sample) | 16.6% | 22.7% |
| Standard Deviation (Population) | 16.5% | 22.4% |
Similar Demographics by In Labor Force | Age 16-19
Demographics Similar to Africans by In Labor Force | Age 16-19
In terms of in labor force | age 16-19, the demographic groups most similar to Africans are Choctaw (38.0%, a difference of 0.010%), New Zealander (38.0%, a difference of 0.010%), Spaniard (38.0%, a difference of 0.030%), Immigrants from Zimbabwe (38.0%, a difference of 0.060%), and Immigrants from Africa (38.0%, a difference of 0.16%).
| Demographics | Rating | Rank | In Labor Force | Age 16-19 |
| Assyrians/Chaldeans/Syriacs | 97.8 /100 | #119 | Exceptional 38.3% |
| Ukrainians | 97.6 /100 | #120 | Exceptional 38.3% |
| Ethiopians | 97.4 /100 | #121 | Exceptional 38.2% |
| Guamanians/Chamorros | 97.4 /100 | #122 | Exceptional 38.2% |
| Seminole | 96.7 /100 | #123 | Exceptional 38.1% |
| Immigrants | England | 96.4 /100 | #124 | Exceptional 38.1% |
| Immigrants | Africa | 96.1 /100 | #125 | Exceptional 38.0% |
| Africans | 95.6 /100 | #126 | Exceptional 38.0% |
| Choctaw | 95.6 /100 | #127 | Exceptional 38.0% |
| New Zealanders | 95.6 /100 | #128 | Exceptional 38.0% |
| Spaniards | 95.5 /100 | #129 | Exceptional 38.0% |
| Immigrants | Zimbabwe | 95.4 /100 | #130 | Exceptional 38.0% |
| Immigrants | Austria | 95.0 /100 | #131 | Exceptional 37.9% |
| Immigrants | Oceania | 94.7 /100 | #132 | Exceptional 37.9% |
| Cheyenne | 94.6 /100 | #133 | Exceptional 37.9% |
Demographics Similar to Immigrants from Egypt by In Labor Force | Age 16-19
In terms of in labor force | age 16-19, the demographic groups most similar to Immigrants from Egypt are Immigrants from South Central Asia (34.6%, a difference of 0.010%), Thai (34.6%, a difference of 0.010%), Immigrants (34.6%, a difference of 0.020%), Egyptian (34.5%, a difference of 0.10%), and Peruvian (34.6%, a difference of 0.11%).
| Demographics | Rating | Rank | In Labor Force | Age 16-19 |
| Immigrants | Pakistan | 2.0 /100 | #250 | Tragic 34.8% |
| Immigrants | Western Asia | 2.0 /100 | #251 | Tragic 34.8% |
| Immigrants | Chile | 2.0 /100 | #252 | Tragic 34.8% |
| Immigrants | Japan | 1.5 /100 | #253 | Tragic 34.7% |
| Bahamians | 1.4 /100 | #254 | Tragic 34.6% |
| Peruvians | 1.4 /100 | #255 | Tragic 34.6% |
| Immigrants | South Central Asia | 1.3 /100 | #256 | Tragic 34.6% |
| Immigrants | Egypt | 1.2 /100 | #257 | Tragic 34.6% |
| Thais | 1.2 /100 | #258 | Tragic 34.6% |
| Immigrants | Immigrants | 1.2 /100 | #259 | Tragic 34.6% |
| Egyptians | 1.2 /100 | #260 | Tragic 34.5% |
| Salvadorans | 1.1 /100 | #261 | Tragic 34.5% |
| Hispanics or Latinos | 1.1 /100 | #262 | Tragic 34.5% |
| Burmese | 1.1 /100 | #263 | Tragic 34.5% |
| Immigrants | Uruguay | 0.9 /100 | #264 | Tragic 34.4% |