African vs Immigrants from Egypt In Labor Force | Age 20-24
COMPARE
African
Immigrants from Egypt
In Labor Force | Age 20-24
In Labor Force | Age 20-24 Comparison
Africans
Immigrants from Egypt
75.0%
IN LABOR FORCE | AGE 20-24
42.5/ 100
METRIC RATING
181st/ 347
METRIC RANK
73.8%
IN LABOR FORCE | AGE 20-24
1.2/ 100
METRIC RATING
251st/ 347
METRIC RANK
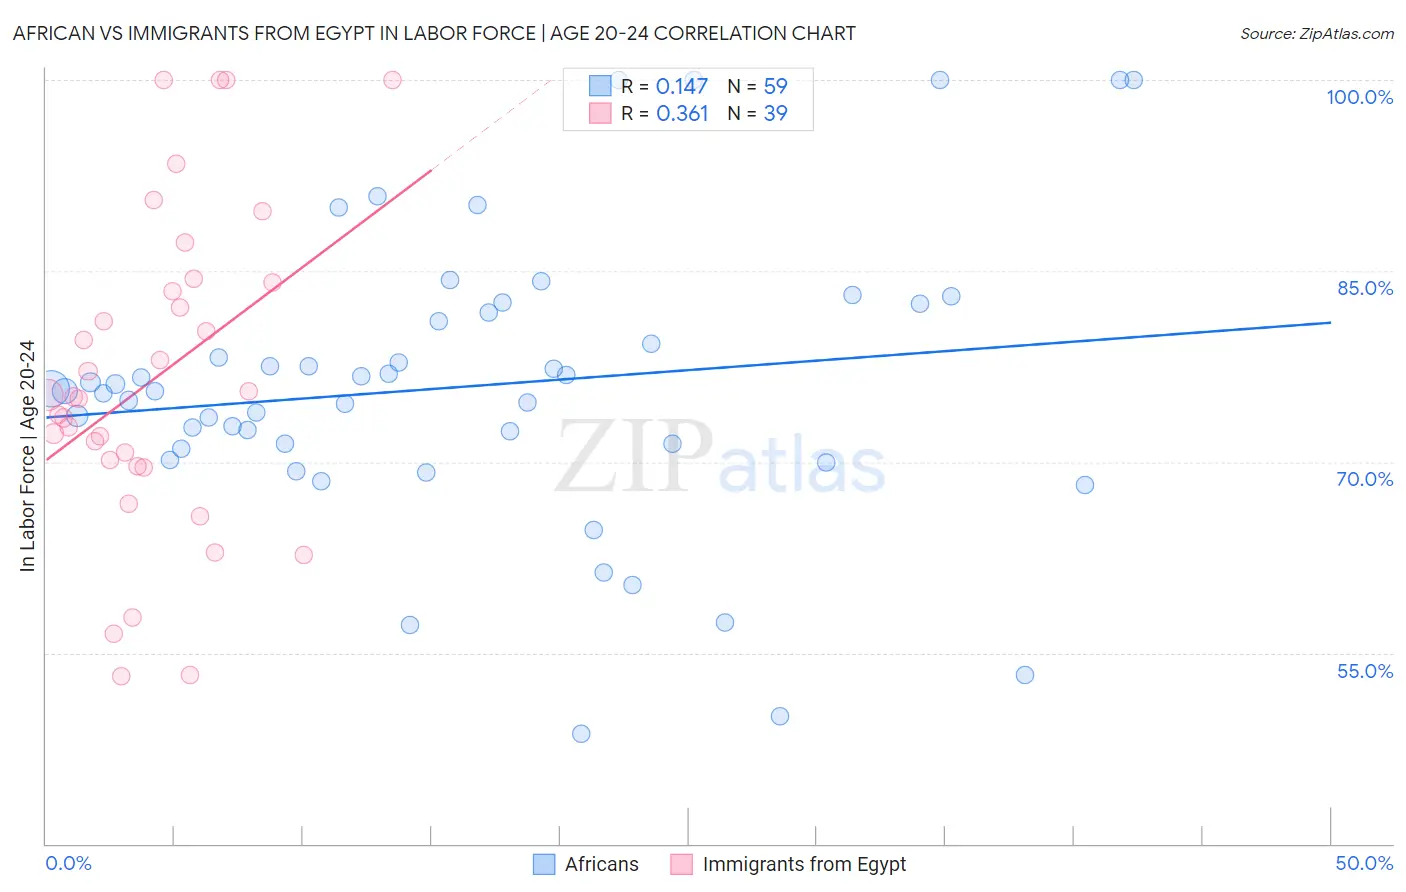
African vs Immigrants from Egypt In Labor Force | Age 20-24 Correlation Chart
The statistical analysis conducted on geographies consisting of 469,871,149 people shows a poor positive correlation between the proportion of Africans and labor force participation rate among population between the ages 20 and 24 in the United States with a correlation coefficient (R) of 0.147 and weighted average of 75.0%. Similarly, the statistical analysis conducted on geographies consisting of 245,464,045 people shows a mild positive correlation between the proportion of Immigrants from Egypt and labor force participation rate among population between the ages 20 and 24 in the United States with a correlation coefficient (R) of 0.361 and weighted average of 73.8%, a difference of 1.5%.
In Labor Force | Age 20-24 Correlation Summary
| Measurement | African | Immigrants from Egypt |
| Minimum | 48.6% | 53.2% |
| Maximum | 100.0% | 100.0% |
| Range | 51.4% | 46.8% |
| Mean | 75.9% | 76.6% |
| Median | 75.6% | 75.1% |
| Interquartile 25% (IQ1) | 71.0% | 69.7% |
| Interquartile 75% (IQ3) | 81.7% | 84.1% |
| Interquartile Range (IQR) | 10.7% | 14.4% |
| Standard Deviation (Sample) | 11.4% | 12.5% |
| Standard Deviation (Population) | 11.3% | 12.3% |
Similar Demographics by In Labor Force | Age 20-24
Demographics Similar to Africans by In Labor Force | Age 20-24
In terms of in labor force | age 20-24, the demographic groups most similar to Africans are Immigrants from Latvia (75.0%, a difference of 0.020%), Immigrants from Czechoslovakia (75.0%, a difference of 0.020%), Immigrants from Central America (75.0%, a difference of 0.040%), Immigrants from Mexico (75.0%, a difference of 0.080%), and Immigrants from South Africa (74.9%, a difference of 0.080%).
| Demographics | Rating | Rank | In Labor Force | Age 20-24 |
| South Africans | 50.0 /100 | #174 | Average 75.0% |
| Syrians | 49.5 /100 | #175 | Average 75.0% |
| Central Americans | 48.7 /100 | #176 | Average 75.0% |
| Immigrants | Mexico | 47.8 /100 | #177 | Average 75.0% |
| Immigrants | Central America | 45.0 /100 | #178 | Average 75.0% |
| Immigrants | Latvia | 44.1 /100 | #179 | Average 75.0% |
| Immigrants | Czechoslovakia | 44.0 /100 | #180 | Average 75.0% |
| Africans | 42.5 /100 | #181 | Average 75.0% |
| Immigrants | South Africa | 36.9 /100 | #182 | Fair 74.9% |
| Immigrants | Costa Rica | 36.7 /100 | #183 | Fair 74.9% |
| Immigrants | Hungary | 35.0 /100 | #184 | Fair 74.9% |
| Sri Lankans | 34.9 /100 | #185 | Fair 74.9% |
| Immigrants | Eastern Europe | 33.8 /100 | #186 | Fair 74.9% |
| Immigrants | Honduras | 33.5 /100 | #187 | Fair 74.9% |
| Hondurans | 32.7 /100 | #188 | Fair 74.8% |
Demographics Similar to Immigrants from Egypt by In Labor Force | Age 20-24
In terms of in labor force | age 20-24, the demographic groups most similar to Immigrants from Egypt are Black/African American (73.9%, a difference of 0.020%), Immigrants from Belgium (73.9%, a difference of 0.020%), Immigrants from Kazakhstan (73.8%, a difference of 0.020%), Immigrants from Saudi Arabia (73.9%, a difference of 0.070%), and Arapaho (73.8%, a difference of 0.070%).
| Demographics | Rating | Rank | In Labor Force | Age 20-24 |
| Immigrants | South Central Asia | 1.9 /100 | #244 | Tragic 74.0% |
| Turks | 1.8 /100 | #245 | Tragic 73.9% |
| Immigrants | Panama | 1.6 /100 | #246 | Tragic 73.9% |
| Colville | 1.5 /100 | #247 | Tragic 73.9% |
| Immigrants | Saudi Arabia | 1.5 /100 | #248 | Tragic 73.9% |
| Blacks/African Americans | 1.3 /100 | #249 | Tragic 73.9% |
| Immigrants | Belgium | 1.3 /100 | #250 | Tragic 73.9% |
| Immigrants | Egypt | 1.2 /100 | #251 | Tragic 73.8% |
| Immigrants | Kazakhstan | 1.1 /100 | #252 | Tragic 73.8% |
| Arapaho | 1.0 /100 | #253 | Tragic 73.8% |
| Ute | 1.0 /100 | #254 | Tragic 73.8% |
| Immigrants | Pakistan | 0.9 /100 | #255 | Tragic 73.8% |
| Spanish American Indians | 0.8 /100 | #256 | Tragic 73.7% |
| Paraguayans | 0.8 /100 | #257 | Tragic 73.7% |
| Egyptians | 0.7 /100 | #258 | Tragic 73.7% |