Zip Codes with the Highest Percentage of Population with a Degree in Science and Engineering in Metairie, LA

RELATED REPORTS & OPTIONS

Science and Engineering
Population
Families and Households
Female Fertility
Female Fertility (Unmarried)
Race (Community Size)
Race (Percentage)
Ancestry (Community Size)
AfricanAmericanArabAustrianBasqueBelgianBelizeanBhutaneseBlackfeetBolivianBrazilianBritishBurmeseCajunCanadianCentral AmericanCentral American IndianCherokeeChoctawColombianCosta RicanCroatianCubanCzechDanishDominicanDutchEastern EuropeanEcuadorianEgyptianEnglishEuropeanFilipinoFrenchFrench CanadianGermanGreekGuatemalanHonduranHoumaHungarianIndian (Asian)IndonesianIraqiIrishItalianJapaneseJordanianKoreanLaotianLebaneseLithuanianMexicanNative HawaiianNicaraguanNigerianNorthern EuropeanNorwegianPakistaniPalestinianPanamanianPeruvianPolishPortuguesePuerto RicanRomanianRussianSalvadoranScandinavianScotch-IrishScottishSlavicSlovakSouth AfricanSouth AmericanSouth American IndianSpaniardSpanishSri LankanSubsaharan AfricanSwedishSwissSyrianThaiTurkishUkrainianVenezuelanVietnameseWelshWest IndianYugoslavian
Ancestry (Percentage)
AfricanAmericanArabAustrianBasqueBelgianBelizeanBhutaneseBlackfeetBolivianBrazilianBritishBurmeseCajunCanadianCentral AmericanCentral American IndianCherokeeChoctawColombianCosta RicanCroatianCubanCzechDanishDominicanDutchEastern EuropeanEcuadorianEgyptianEnglishEuropeanFilipinoFrenchFrench CanadianGermanGreekGuatemalanHonduranHoumaHungarianIndian (Asian)IndonesianIraqiIrishItalianJapaneseJordanianKoreanLaotianLebaneseLithuanianMexicanNative HawaiianNicaraguanNigerianNorthern EuropeanNorwegianPakistaniPalestinianPanamanianPeruvianPolishPortuguesePuerto RicanRomanianRussianSalvadoranScandinavianScotch-IrishScottishSlavicSlovakSouth AfricanSouth AmericanSouth American IndianSpaniardSpanishSri LankanSubsaharan AfricanSwedishSwissSyrianThaiTurkishUkrainianVenezuelanVietnameseWelshWest IndianYugoslavian
Immigrant Origin (Total)
Immigrant Origin (Percentage)
Income
Income (Families)
Income (Households)
Poverty
Poverty (Families)
Unemployment
Employment Occupations
Employment Industries
Employer Class
Commute Time
Commute Means
School Enrollment
Education by Degree Field
Occupancy
Finances
Physical Characteristics
Metairie
Compare Zip Codes
Comparison Subject

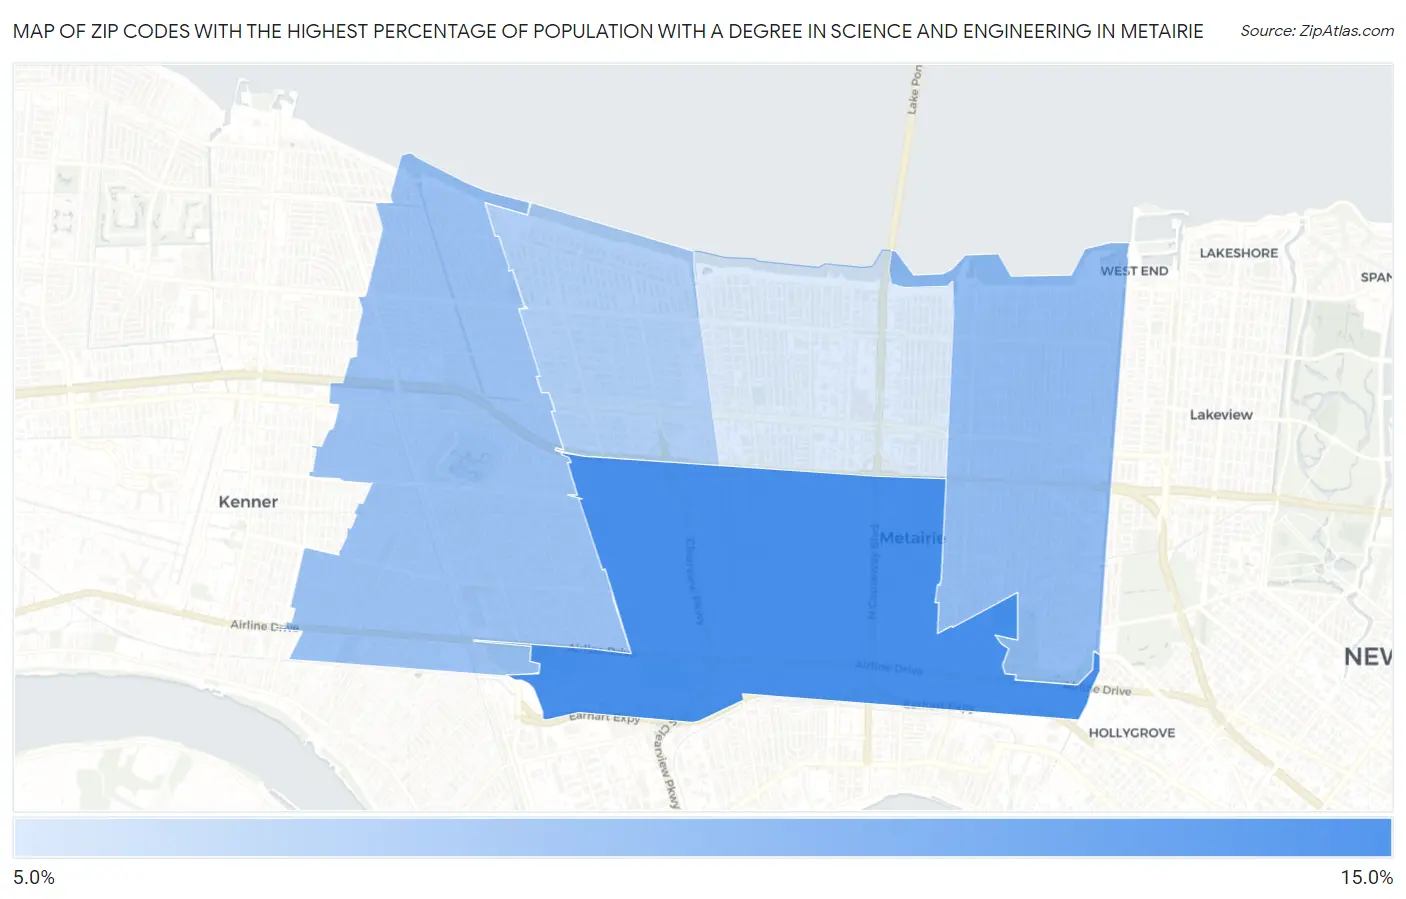
Map of Zip Codes with the Highest Percentage of Population with a Degree in Science and Engineering in Metairie

0.0%
15.0%
Zip Codes with the Highest Percentage of Population with a Degree in Science and Engineering in Metairie Map

Zip Codes with the Highest Percentage of Population with a Degree in Science and Engineering in Metairie, LA

Zip Code % Graduates vs State vs National
1.7000114.1%12.6%(+1.48)#1929.8%(+4.28)#7,777
2.7000511.0%12.6%(-1.55)#2539.8%(+1.25)#12,816
3.7000310.8%12.6%(-1.75)#2609.8%(+1.05)#13,239
4.700069.9%12.6%(-2.71)#2839.8%(+0.093)#15,317
5.700028.2%12.6%(-4.36)#3349.8%(-1.55)#19,123

Common Questions

What are the Top 3 Zip Codes with the Highest Percentage of Population with a Degree in Science and Engineering in Metairie, LA?
Top 3 Zip Codes with the Highest Percentage of Population with a Degree in Science and Engineering in Metairie, LA are:
#1
14.1%
#2
11.0%
#3
10.8%
What zip code has the Highest Percentage of Population with a Degree in Science and Engineering in Metairie, LA?
70001 has the Highest Percentage of Population with a Degree in Science and Engineering in Metairie, LA with 14.1%.
What is the Percentage of Population with a Degree in Science and Engineering in Metairie, LA?
Percentage of Population with a Degree in Science and Engineering in Metairie is 11.1%.
What is the Percentage of Population with a Degree in Science and Engineering in Louisiana?
Percentage of Population with a Degree in Science and Engineering in Louisiana is 12.6%.
What is the Percentage of Population with a Degree in Science and Engineering in the United States?
Percentage of Population with a Degree in Science and Engineering in the United States is 9.8%.