Yuman vs Zimbabwean Median Female Earnings
COMPARE
Yuman
Zimbabwean
Median Female Earnings
Median Female Earnings Comparison
Yuman
Zimbabweans
$35,377
MEDIAN FEMALE EARNINGS
0.0/ 100
METRIC RATING
300th/ 347
METRIC RANK
$40,798
MEDIAN FEMALE EARNINGS
90.8/ 100
METRIC RATING
129th/ 347
METRIC RANK
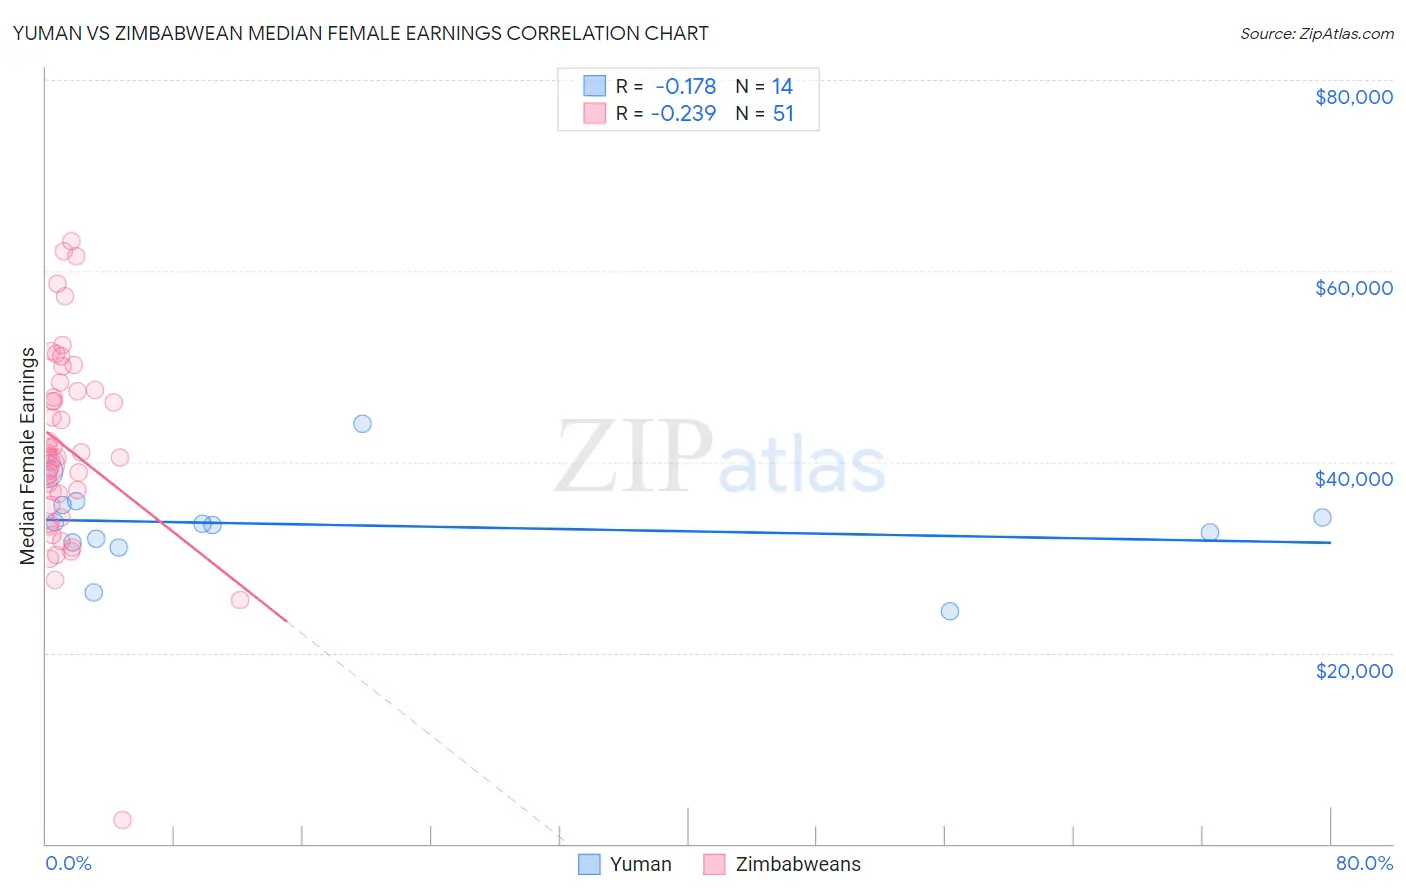
Yuman vs Zimbabwean Median Female Earnings Correlation Chart
The statistical analysis conducted on geographies consisting of 40,678,701 people shows a poor negative correlation between the proportion of Yuman and median female earnings in the United States with a correlation coefficient (R) of -0.178 and weighted average of $35,377. Similarly, the statistical analysis conducted on geographies consisting of 69,205,831 people shows a weak negative correlation between the proportion of Zimbabweans and median female earnings in the United States with a correlation coefficient (R) of -0.239 and weighted average of $40,798, a difference of 15.3%.
Median Female Earnings Correlation Summary
| Measurement | Yuman | Zimbabwean |
| Minimum | $24,415 | $2,499 |
| Maximum | $43,952 | $63,108 |
| Range | $19,537 | $60,609 |
| Mean | $33,355 | $41,512 |
| Median | $33,435 | $40,486 |
| Interquartile 25% (IQ1) | $31,604 | $35,420 |
| Interquartile 75% (IQ3) | $35,454 | $47,538 |
| Interquartile Range (IQR) | $3,850 | $12,118 |
| Standard Deviation (Sample) | $4,771 | $10,575 |
| Standard Deviation (Population) | $4,598 | $10,471 |
Similar Demographics by Median Female Earnings
Demographics Similar to Yuman by Median Female Earnings
In terms of median female earnings, the demographic groups most similar to Yuman are Pima ($35,326, a difference of 0.14%), Black/African American ($35,315, a difference of 0.18%), Immigrants from Guatemala ($35,444, a difference of 0.19%), Immigrants from Latin America ($35,307, a difference of 0.20%), and Immigrants from Micronesia ($35,477, a difference of 0.28%).
| Demographics | Rating | Rank | Median Female Earnings |
| Guatemalans | 0.0 /100 | #293 | Tragic $35,695 |
| Cheyenne | 0.0 /100 | #294 | Tragic $35,673 |
| Comanche | 0.0 /100 | #295 | Tragic $35,661 |
| Mexican American Indians | 0.0 /100 | #296 | Tragic $35,629 |
| Hmong | 0.0 /100 | #297 | Tragic $35,498 |
| Immigrants | Micronesia | 0.0 /100 | #298 | Tragic $35,477 |
| Immigrants | Guatemala | 0.0 /100 | #299 | Tragic $35,444 |
| Yuman | 0.0 /100 | #300 | Tragic $35,377 |
| Pima | 0.0 /100 | #301 | Tragic $35,326 |
| Blacks/African Americans | 0.0 /100 | #302 | Tragic $35,315 |
| Immigrants | Latin America | 0.0 /100 | #303 | Tragic $35,307 |
| Crow | 0.0 /100 | #304 | Tragic $35,266 |
| Bahamians | 0.0 /100 | #305 | Tragic $35,125 |
| Fijians | 0.0 /100 | #306 | Tragic $35,114 |
| Sioux | 0.0 /100 | #307 | Tragic $35,063 |
Demographics Similar to Zimbabweans by Median Female Earnings
In terms of median female earnings, the demographic groups most similar to Zimbabweans are Immigrants from Guyana ($40,773, a difference of 0.060%), Carpatho Rusyn ($40,825, a difference of 0.070%), Chilean ($40,757, a difference of 0.10%), Immigrants from Uganda ($40,739, a difference of 0.14%), and Syrian ($40,727, a difference of 0.17%).
| Demographics | Rating | Rank | Median Female Earnings |
| Immigrants | Jordan | 93.5 /100 | #122 | Exceptional $40,977 |
| Guyanese | 93.4 /100 | #123 | Exceptional $40,973 |
| Trinidadians and Tobagonians | 93.2 /100 | #124 | Exceptional $40,958 |
| Austrians | 92.7 /100 | #125 | Exceptional $40,923 |
| Immigrants | Trinidad and Tobago | 92.3 /100 | #126 | Exceptional $40,895 |
| Ugandans | 92.2 /100 | #127 | Exceptional $40,889 |
| Carpatho Rusyns | 91.2 /100 | #128 | Exceptional $40,825 |
| Zimbabweans | 90.8 /100 | #129 | Exceptional $40,798 |
| Immigrants | Guyana | 90.3 /100 | #130 | Exceptional $40,773 |
| Chileans | 90.0 /100 | #131 | Exceptional $40,757 |
| Immigrants | Uganda | 89.7 /100 | #132 | Excellent $40,739 |
| Syrians | 89.5 /100 | #133 | Excellent $40,727 |
| Arabs | 89.3 /100 | #134 | Excellent $40,718 |
| Immigrants | Nepal | 89.0 /100 | #135 | Excellent $40,704 |
| Immigrants | Eastern Africa | 87.7 /100 | #136 | Excellent $40,644 |