Immigrants from North America vs Zimbabwean Median Female Earnings
COMPARE
Immigrants from North America
Zimbabwean
Median Female Earnings
Median Female Earnings Comparison
Immigrants from North America
Zimbabweans
$41,319
MEDIAN FEMALE EARNINGS
96.7/ 100
METRIC RATING
112th/ 347
METRIC RANK
$40,798
MEDIAN FEMALE EARNINGS
90.8/ 100
METRIC RATING
129th/ 347
METRIC RANK
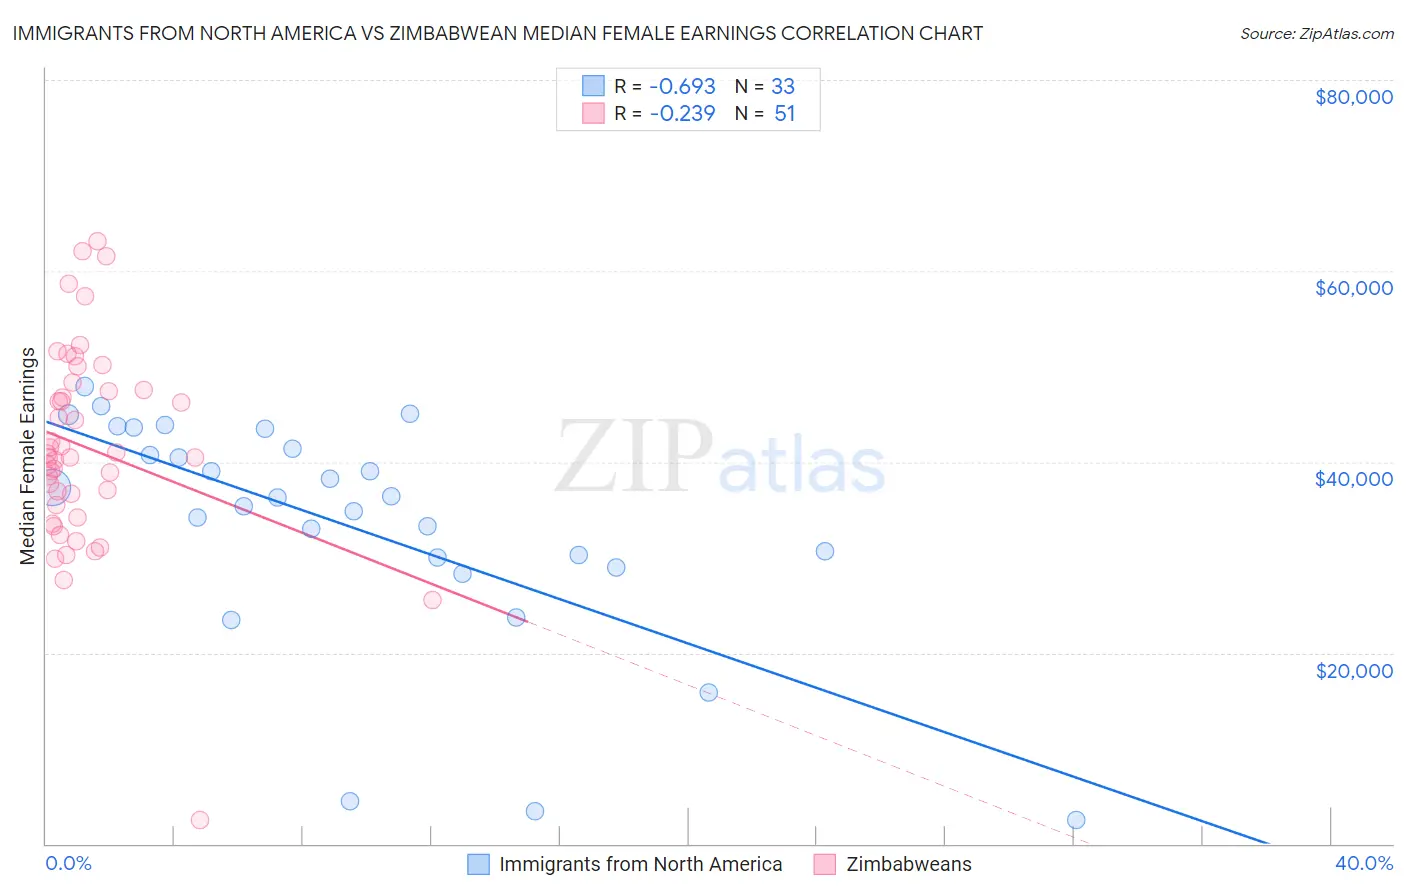
Immigrants from North America vs Zimbabwean Median Female Earnings Correlation Chart
The statistical analysis conducted on geographies consisting of 462,086,595 people shows a significant negative correlation between the proportion of Immigrants from North America and median female earnings in the United States with a correlation coefficient (R) of -0.693 and weighted average of $41,319. Similarly, the statistical analysis conducted on geographies consisting of 69,205,831 people shows a weak negative correlation between the proportion of Zimbabweans and median female earnings in the United States with a correlation coefficient (R) of -0.239 and weighted average of $40,798, a difference of 1.3%.
Median Female Earnings Correlation Summary
| Measurement | Immigrants from North America | Zimbabwean |
| Minimum | $2,499 | $2,499 |
| Maximum | $47,877 | $63,108 |
| Range | $45,378 | $60,609 |
| Mean | $33,312 | $41,512 |
| Median | $36,283 | $40,486 |
| Interquartile 25% (IQ1) | $29,495 | $35,420 |
| Interquartile 75% (IQ3) | $42,384 | $47,538 |
| Interquartile Range (IQR) | $12,888 | $12,118 |
| Standard Deviation (Sample) | $12,008 | $10,575 |
| Standard Deviation (Population) | $11,825 | $10,471 |
Demographics Similar to Immigrants from North America and Zimbabweans by Median Female Earnings
In terms of median female earnings, the demographic groups most similar to Immigrants from North America are Macedonian ($41,286, a difference of 0.080%), Immigrants from England ($41,277, a difference of 0.10%), Korean ($41,276, a difference of 0.10%), Immigrants from Brazil ($41,273, a difference of 0.11%), and Immigrants from Canada ($41,373, a difference of 0.13%). Similarly, the demographic groups most similar to Zimbabweans are Immigrants from Guyana ($40,773, a difference of 0.060%), Carpatho Rusyn ($40,825, a difference of 0.070%), Ugandan ($40,889, a difference of 0.22%), Immigrants from Trinidad and Tobago ($40,895, a difference of 0.24%), and Austrian ($40,923, a difference of 0.31%).
| Demographics | Rating | Rank | Median Female Earnings |
| Immigrants | Western Asia | 97.0 /100 | #110 | Exceptional $41,375 |
| Immigrants | Canada | 97.0 /100 | #111 | Exceptional $41,373 |
| Immigrants | North America | 96.7 /100 | #112 | Exceptional $41,319 |
| Macedonians | 96.4 /100 | #113 | Exceptional $41,286 |
| Immigrants | England | 96.4 /100 | #114 | Exceptional $41,277 |
| Koreans | 96.4 /100 | #115 | Exceptional $41,276 |
| Immigrants | Brazil | 96.4 /100 | #116 | Exceptional $41,273 |
| Barbadians | 96.3 /100 | #117 | Exceptional $41,261 |
| Immigrants | Lebanon | 95.6 /100 | #118 | Exceptional $41,183 |
| Immigrants | Philippines | 95.0 /100 | #119 | Exceptional $41,114 |
| Immigrants | Kuwait | 94.4 /100 | #120 | Exceptional $41,055 |
| Croatians | 93.7 /100 | #121 | Exceptional $40,993 |
| Immigrants | Jordan | 93.5 /100 | #122 | Exceptional $40,977 |
| Guyanese | 93.4 /100 | #123 | Exceptional $40,973 |
| Trinidadians and Tobagonians | 93.2 /100 | #124 | Exceptional $40,958 |
| Austrians | 92.7 /100 | #125 | Exceptional $40,923 |
| Immigrants | Trinidad and Tobago | 92.3 /100 | #126 | Exceptional $40,895 |
| Ugandans | 92.2 /100 | #127 | Exceptional $40,889 |
| Carpatho Rusyns | 91.2 /100 | #128 | Exceptional $40,825 |
| Zimbabweans | 90.8 /100 | #129 | Exceptional $40,798 |
| Immigrants | Guyana | 90.3 /100 | #130 | Exceptional $40,773 |