Yuman vs Immigrants from Peru Wage/Income Gap

COMPARE

Yuman
Race
Ancestry
AfghanAfricanAlaska NativeAlaskan AthabascanAlbanianAleutAlsatianAmericanApacheArabArapahoArgentineanArmenianAssyrian/Chaldean/SyriacAustralianAustrianBahamianBangladeshiBarbadianBasqueBelgianBelizeanBermudanBhutaneseBlackfeetBolivianBrazilianBritishBritish West IndianBulgarianBurmeseCajunCambodianCanadianCape VerdeanCarpatho RusynCelticCentral AmericanCentral American IndianCherokeeCheyenneChickasawChileanChineseChippewaChoctawColombianColvilleComancheCosta RicanCreeCreekCroatianCrowCubanCypriotCzechCzechoslovakianDanishDelawareDominicanDutchDutch West IndianEastern EuropeanEcuadorianEgyptianEnglishEstonianEthiopianEuropeanFijianFilipinoFinnishFrenchFrench American IndianFrench CanadianGermanGerman RussianGhanaianGreekGuamanian/ChamorroGuatemalanGuyaneseHaitianHmongHonduranHopiHoumaHungarianIcelanderIndian (Asian)IndonesianInupiatIranianIraqiIrishIroquoisIsraeliItalianJamaicanJapaneseJordanianKenyanKiowaKoreanLaotianLatvianLebaneseLiberianLithuanianLumbeeLuxembourgerMacedonianMalaysianMalteseMarshalleseMenomineeMexicanMexican American IndianMongolianMoroccanNative HawaiianNavajoNepaleseNew ZealanderNicaraguanNigerianNorthern EuropeanNorwegianOkinawanOsageOttawaPaiutePakistaniPalestinianPanamanianParaguayanPennsylvania GermanPeruvianPimaPolishPortuguesePotawatomiPuebloPuerto RicanPuget Sound SalishRomanianRussianSalvadoranSamoanScandinavianScotch-IrishScottishSeminoleSenegaleseSerbianShoshoneSierra LeoneanSiouxSlavicSlovakSloveneSomaliSouth AfricanSouth AmericanSouth American IndianSoviet UnionSpaniardSpanishSpanish AmericanSpanish American IndianSri LankanSubsaharan AfricanSudaneseSwedishSwissSyrianTaiwaneseThaiTlingit-HaidaTohono O'OdhamTonganTrinidadian and TobagonianTsimshianTurkishU.S. Virgin IslanderUgandanUkrainianUruguayanUteVenezuelanVietnameseWelshWest IndianYakamaYaquiYugoslavianYumanYup'ikZimbabwean
Immigration
NonimmigrantsImmigrantsAfghanistanAfricaAlbaniaArgentinaArmeniaAsiaAustraliaAustriaBahamasBangladeshBarbadosBelarusBelgiumBelizeBoliviaBosnia and HerzegovinaBrazilBulgariaBurma/MyanmarCabo VerdeCambodiaCameroonCanadaCaribbeanCentral AmericaChileChinaColombiaCongoCosta RicaCroatiaCubaCzechoslovakiaDenmarkDominicaDominican RepublicEastern AfricaEastern AsiaEastern EuropeEcuadorEgyptEl SalvadorEnglandEritreaEthiopiaEuropeFijiFranceGermanyGhanaGreeceGrenadaGuatemalaGuyanaHaitiHondurasHong KongHungaryIndiaIndonesiaIranIraqIrelandIsraelItalyJamaicaJapanJordanKazakhstanKenyaKoreaKuwaitLaosLatin AmericaLatviaLebanonLiberiaLithuaniaMalaysiaMexicoMicronesiaMiddle AfricaMoldovaMoroccoNepalNetherlandsNicaraguaNigeriaNorth AmericaNorth MacedoniaNorthern AfricaNorthern EuropeNorwayOceaniaPakistanPanamaPhilippinesPolandPortugalRomaniaRussiaSaudi ArabiaScotlandSenegalSerbiaSierra LeoneSingaporeSomaliaSouth AfricaSouth AmericaSouth Central AsiaSouth Eastern AsiaSouthern EuropeSpainSri LankaSt. Vincent and the GrenadinesSudanSwedenSwitzerlandSyriaTaiwanThailandTrinidad and TobagoTurkeyUgandaUkraineUruguayUzbekistanVenezuelaVietnamWest IndiesWestern AfricaWestern AsiaWestern EuropeYemenZaireZimbabweAzores
Immigrants from Peru
Race
Ancestry
AfghanAfricanAlaska NativeAlaskan AthabascanAlbanianAleutAlsatianAmericanApacheArabArapahoArgentineanArmenianAssyrian/Chaldean/SyriacAustralianAustrianBahamianBangladeshiBarbadianBasqueBelgianBelizeanBermudanBhutaneseBlackfeetBolivianBrazilianBritishBritish West IndianBulgarianBurmeseCajunCambodianCanadianCape VerdeanCarpatho RusynCelticCentral AmericanCentral American IndianCherokeeCheyenneChickasawChileanChineseChippewaChoctawColombianColvilleComancheCosta RicanCreeCreekCroatianCrowCubanCypriotCzechCzechoslovakianDanishDelawareDominicanDutchDutch West IndianEastern EuropeanEcuadorianEgyptianEnglishEstonianEthiopianEuropeanFijianFilipinoFinnishFrenchFrench American IndianFrench CanadianGermanGerman RussianGhanaianGreekGuamanian/ChamorroGuatemalanGuyaneseHaitianHmongHonduranHopiHoumaHungarianIcelanderIndian (Asian)IndonesianInupiatIranianIraqiIrishIroquoisIsraeliItalianJamaicanJapaneseJordanianKenyanKiowaKoreanLaotianLatvianLebaneseLiberianLithuanianLumbeeLuxembourgerMacedonianMalaysianMalteseMarshalleseMenomineeMexicanMexican American IndianMongolianMoroccanNative HawaiianNavajoNepaleseNew ZealanderNicaraguanNigerianNorthern EuropeanNorwegianOkinawanOsageOttawaPaiutePakistaniPalestinianPanamanianParaguayanPennsylvania GermanPeruvianPimaPolishPortuguesePotawatomiPuebloPuerto RicanPuget Sound SalishRomanianRussianSalvadoranSamoanScandinavianScotch-IrishScottishSeminoleSenegaleseSerbianShoshoneSierra LeoneanSiouxSlavicSlovakSloveneSomaliSouth AfricanSouth AmericanSouth American IndianSoviet UnionSpaniardSpanishSpanish AmericanSpanish American IndianSri LankanSubsaharan AfricanSudaneseSwedishSwissSyrianTaiwaneseThaiTlingit-HaidaTohono O'OdhamTonganTrinidadian and TobagonianTsimshianTurkishU.S. Virgin IslanderUgandanUkrainianUruguayanUteVenezuelanVietnameseWelshWest IndianYakamaYaquiYugoslavianYup'ikZimbabwean
Immigration
NonimmigrantsImmigrantsAfghanistanAfricaAlbaniaArgentinaArmeniaAsiaAustraliaAustriaBahamasBangladeshBarbadosBelarusBelgiumBelizeBoliviaBosnia and HerzegovinaBrazilBulgariaBurma/MyanmarCabo VerdeCambodiaCameroonCanadaCaribbeanCentral AmericaChileChinaColombiaCongoCosta RicaCroatiaCubaCzechoslovakiaDenmarkDominicaDominican RepublicEastern AfricaEastern AsiaEastern EuropeEcuadorEgyptEl SalvadorEnglandEritreaEthiopiaEuropeFijiFranceGermanyGhanaGreeceGrenadaGuatemalaGuyanaHaitiHondurasHong KongHungaryIndiaIndonesiaIranIraqIrelandIsraelItalyJamaicaJapanJordanKazakhstanKenyaKoreaKuwaitLaosLatin AmericaLatviaLebanonLiberiaLithuaniaMalaysiaMexicoMicronesiaMiddle AfricaMoldovaMoroccoNepalNetherlandsNicaraguaNigeriaNorth AmericaNorth MacedoniaNorthern AfricaNorthern EuropeNorwayOceaniaPakistanPanamaPeruPhilippinesPolandPortugalRomaniaRussiaSaudi ArabiaScotlandSenegalSerbiaSierra LeoneSingaporeSomaliaSouth AfricaSouth AmericaSouth Central AsiaSouth Eastern AsiaSouthern EuropeSpainSri LankaSt. Vincent and the GrenadinesSudanSwedenSwitzerlandSyriaTaiwanThailandTrinidad and TobagoTurkeyUgandaUkraineUruguayUzbekistanVenezuelaVietnamWest IndiesWestern AfricaWestern AsiaWestern EuropeYemenZaireZimbabweAzores
Wage/Income Gap
Income
Poverty
Unemployment
Labor Participation
Family Structure
Vehicle Availability
Education Level
Disability

Wage/Income Gap Comparison

Yuman

Immigrants from Peru

Exceptional
Excellent
23.3%
WAGE/INCOME GAP
99.7/ 100
METRIC RATING
87th/ 347
METRIC RANK
25.1%
WAGE/INCOME GAP
82.6/ 100
METRIC RATING
149th/ 347
METRIC RANK

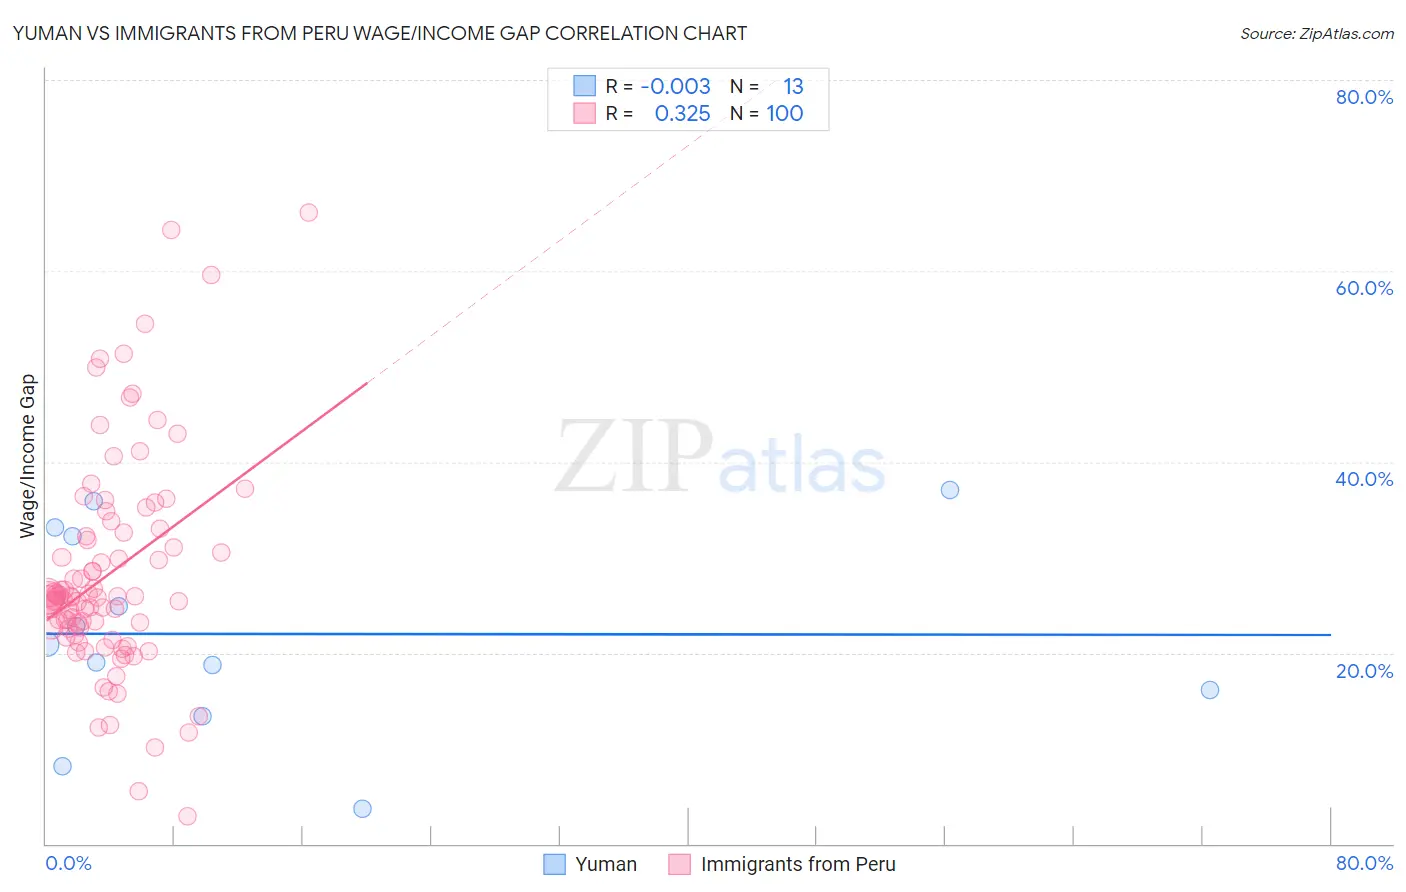
Yuman vs Immigrants from Peru Wage/Income Gap Correlation Chart

The statistical analysis conducted on geographies consisting of 40,661,382 people shows no correlation between the proportion of Yuman and wage/income gap percentage in the United States with a correlation coefficient (R) of -0.003 and weighted average of 23.3%. Similarly, the statistical analysis conducted on geographies consisting of 328,741,739 people shows a mild positive correlation between the proportion of Immigrants from Peru and wage/income gap percentage in the United States with a correlation coefficient (R) of 0.325 and weighted average of 25.1%, a difference of 7.6%.
Yuman vs Immigrants from Peru Wage/Income Gap

Wage/Income Gap Correlation Summary

MeasurementYumanImmigrants from Peru
Minimum3.7%2.9%
Maximum37.0%66.2%
Range33.3%63.3%
Mean22.0%28.2%
Median20.9%25.8%
Interquartile 25% (IQ1)14.7%22.6%
Interquartile 75% (IQ3)32.7%32.4%
Interquartile Range (IQR)18.0%9.8%
Standard Deviation (Sample)10.5%11.3%
Standard Deviation (Population)10.1%11.2%

Similar Demographics by Wage/Income Gap

Demographics Similar to Yuman by Wage/Income Gap

In terms of wage/income gap, the demographic groups most similar to Yuman are Cheyenne (23.3%, a difference of 0.050%), Immigrants from Cambodia (23.3%, a difference of 0.25%), Cuban (23.3%, a difference of 0.31%), Immigrants from Panama (23.4%, a difference of 0.32%), and Marshallese (23.4%, a difference of 0.41%).
DemographicsRating | RankWage/Income Gap
Salvadorans
99.9
/100
|
#80
Exceptional
23.0%
Bermudans
99.8
/100
|
#81
Exceptional
23.1%
Central Americans
99.8
/100
|
#82
Exceptional
23.1%
Immigrants | Africa
99.8
/100
|
#83
Exceptional
23.2%
Cubans
99.7
/100
|
#84
Exceptional
23.3%
Immigrants | Cambodia
99.7
/100
|
#85
Exceptional
23.3%
Cheyenne
99.7
/100
|
#86
Exceptional
23.3%
Yuman
99.7
/100
|
#87
Exceptional
23.3%
Immigrants | Panama
99.6
/100
|
#88
Exceptional
23.4%
Marshallese
99.6
/100
|
#89
Exceptional
23.4%
Nicaraguans
99.6
/100
|
#90
Exceptional
23.4%
Arapaho
99.6
/100
|
#91
Exceptional
23.5%
Immigrants | Honduras
99.5
/100
|
#92
Exceptional
23.5%
Immigrants | Cabo Verde
99.5
/100
|
#93
Exceptional
23.6%
Hondurans
99.5
/100
|
#94
Exceptional
23.6%

Demographics Similar to Immigrants from Peru by Wage/Income Gap

In terms of wage/income gap, the demographic groups most similar to Immigrants from Peru are Immigrants (25.1%, a difference of 0.040%), Taiwanese (25.1%, a difference of 0.12%), Iroquois (25.1%, a difference of 0.15%), Uruguayan (25.2%, a difference of 0.16%), and Malaysian (25.0%, a difference of 0.28%).
DemographicsRating | RankWage/Income Gap
Afghans
88.1
/100
|
#142
Excellent
24.9%
Immigrants | Uganda
88.0
/100
|
#143
Excellent
24.9%
Chippewa
86.9
/100
|
#144
Excellent
25.0%
Comanche
85.2
/100
|
#145
Excellent
25.0%
South Americans
85.2
/100
|
#146
Excellent
25.0%
Malaysians
84.9
/100
|
#147
Excellent
25.0%
Iroquois
83.9
/100
|
#148
Excellent
25.1%
Immigrants | Peru
82.6
/100
|
#149
Excellent
25.1%
Immigrants | Immigrants
82.3
/100
|
#150
Excellent
25.1%
Taiwanese
81.6
/100
|
#151
Excellent
25.1%
Uruguayans
81.3
/100
|
#152
Excellent
25.2%
Blackfeet
78.1
/100
|
#153
Good
25.2%
Immigrants | Northern Africa
78.1
/100
|
#154
Good
25.2%
Immigrants | Vietnam
77.7
/100
|
#155
Good
25.2%
Immigrants | Mexico
76.4
/100
|
#156
Good
25.3%