Yaqui vs Colombian Median Family Income
COMPARE
Yaqui
Colombian
Median Family Income
Median Family Income Comparison
Yaqui
Colombians
$87,289
MEDIAN FAMILY INCOME
0.0/ 100
METRIC RATING
295th/ 347
METRIC RANK
$100,750
MEDIAN FAMILY INCOME
27.2/ 100
METRIC RATING
191st/ 347
METRIC RANK
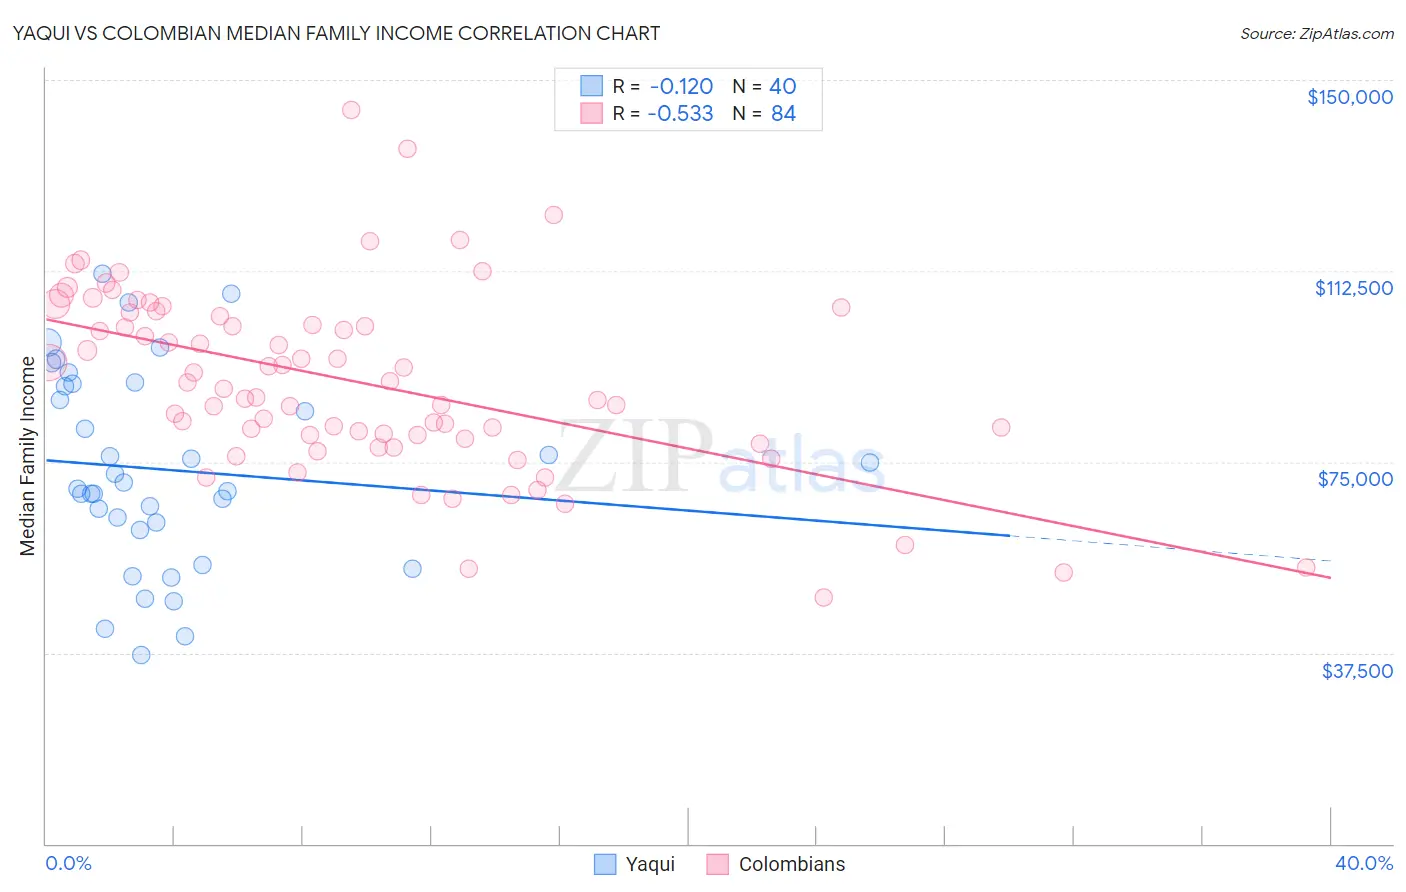
Yaqui vs Colombian Median Family Income Correlation Chart
The statistical analysis conducted on geographies consisting of 107,704,504 people shows a poor negative correlation between the proportion of Yaqui and median family income in the United States with a correlation coefficient (R) of -0.120 and weighted average of $87,289. Similarly, the statistical analysis conducted on geographies consisting of 419,162,834 people shows a substantial negative correlation between the proportion of Colombians and median family income in the United States with a correlation coefficient (R) of -0.533 and weighted average of $100,750, a difference of 15.4%.
Median Family Income Correlation Summary
| Measurement | Yaqui | Colombian |
| Minimum | $37,174 | $48,304 |
| Maximum | $111,841 | $144,224 |
| Range | $74,667 | $95,920 |
| Mean | $73,462 | $90,772 |
| Median | $70,310 | $90,051 |
| Interquartile 25% (IQ1) | $62,336 | $79,908 |
| Interquartile 75% (IQ3) | $90,136 | $103,968 |
| Interquartile Range (IQR) | $27,800 | $24,060 |
| Standard Deviation (Sample) | $19,183 | $18,065 |
| Standard Deviation (Population) | $18,942 | $17,957 |
Similar Demographics by Median Family Income
Demographics Similar to Yaqui by Median Family Income
In terms of median family income, the demographic groups most similar to Yaqui are Fijian ($87,387, a difference of 0.11%), Immigrants from Guatemala ($87,191, a difference of 0.11%), Cajun ($87,157, a difference of 0.15%), Immigrants from Latin America ($86,989, a difference of 0.34%), and Ute ($87,596, a difference of 0.35%).
| Demographics | Rating | Rank | Median Family Income |
| Cherokee | 0.1 /100 | #288 | Tragic $88,209 |
| Central American Indians | 0.1 /100 | #289 | Tragic $88,034 |
| Shoshone | 0.1 /100 | #290 | Tragic $87,872 |
| Immigrants | Cabo Verde | 0.1 /100 | #291 | Tragic $87,830 |
| Africans | 0.1 /100 | #292 | Tragic $87,820 |
| Ute | 0.0 /100 | #293 | Tragic $87,596 |
| Fijians | 0.0 /100 | #294 | Tragic $87,387 |
| Yaqui | 0.0 /100 | #295 | Tragic $87,289 |
| Immigrants | Guatemala | 0.0 /100 | #296 | Tragic $87,191 |
| Cajuns | 0.0 /100 | #297 | Tragic $87,157 |
| Immigrants | Latin America | 0.0 /100 | #298 | Tragic $86,989 |
| Chippewa | 0.0 /100 | #299 | Tragic $86,852 |
| Ottawa | 0.0 /100 | #300 | Tragic $86,380 |
| Colville | 0.0 /100 | #301 | Tragic $85,792 |
| Spanish American Indians | 0.0 /100 | #302 | Tragic $85,728 |
Demographics Similar to Colombians by Median Family Income
In terms of median family income, the demographic groups most similar to Colombians are Immigrants from Kenya ($100,679, a difference of 0.070%), Iraqi ($100,658, a difference of 0.090%), Uruguayan ($100,656, a difference of 0.090%), Immigrants ($100,962, a difference of 0.21%), and Immigrants from Portugal ($100,984, a difference of 0.23%).
| Demographics | Rating | Rank | Median Family Income |
| Immigrants | Costa Rica | 33.7 /100 | #184 | Fair $101,354 |
| Dutch | 31.9 /100 | #185 | Fair $101,192 |
| Celtics | 31.3 /100 | #186 | Fair $101,139 |
| Tlingit-Haida | 30.8 /100 | #187 | Fair $101,092 |
| Guamanians/Chamorros | 30.5 /100 | #188 | Fair $101,061 |
| Immigrants | Portugal | 29.6 /100 | #189 | Fair $100,984 |
| Immigrants | Immigrants | 29.4 /100 | #190 | Fair $100,962 |
| Colombians | 27.2 /100 | #191 | Fair $100,750 |
| Immigrants | Kenya | 26.5 /100 | #192 | Fair $100,679 |
| Iraqis | 26.3 /100 | #193 | Fair $100,658 |
| Uruguayans | 26.3 /100 | #194 | Fair $100,656 |
| Immigrants | South America | 23.9 /100 | #195 | Fair $100,414 |
| Samoans | 23.3 /100 | #196 | Fair $100,344 |
| Immigrants | Cameroon | 22.8 /100 | #197 | Fair $100,289 |
| Immigrants | Africa | 22.5 /100 | #198 | Fair $100,256 |