Romanian vs Colombian Median Family Income
COMPARE
Romanian
Colombian
Median Family Income
Median Family Income Comparison
Romanians
Colombians
$111,243
MEDIAN FAMILY INCOME
98.8/ 100
METRIC RATING
88th/ 347
METRIC RANK
$100,750
MEDIAN FAMILY INCOME
27.2/ 100
METRIC RATING
191st/ 347
METRIC RANK
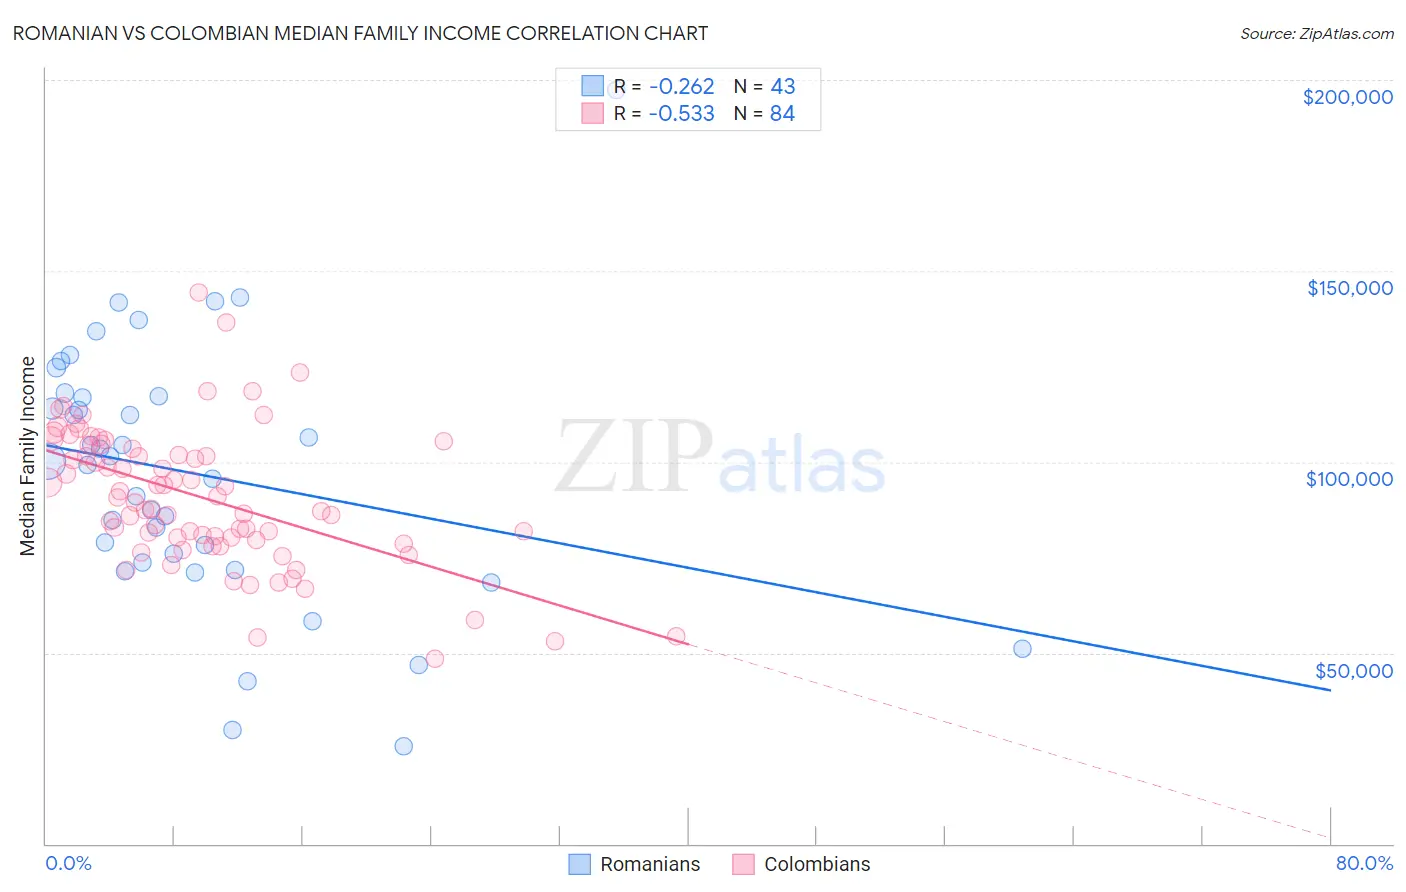
Romanian vs Colombian Median Family Income Correlation Chart
The statistical analysis conducted on geographies consisting of 377,611,628 people shows a weak negative correlation between the proportion of Romanians and median family income in the United States with a correlation coefficient (R) of -0.262 and weighted average of $111,243. Similarly, the statistical analysis conducted on geographies consisting of 419,162,834 people shows a substantial negative correlation between the proportion of Colombians and median family income in the United States with a correlation coefficient (R) of -0.533 and weighted average of $100,750, a difference of 10.4%.
Median Family Income Correlation Summary
| Measurement | Romanian | Colombian |
| Minimum | $25,417 | $48,304 |
| Maximum | $197,500 | $144,224 |
| Range | $172,083 | $95,920 |
| Mean | $96,934 | $90,772 |
| Median | $100,017 | $90,051 |
| Interquartile 25% (IQ1) | $73,551 | $79,908 |
| Interquartile 75% (IQ3) | $117,024 | $103,968 |
| Interquartile Range (IQR) | $43,473 | $24,060 |
| Standard Deviation (Sample) | $33,876 | $18,065 |
| Standard Deviation (Population) | $33,480 | $17,957 |
Similar Demographics by Median Family Income
Demographics Similar to Romanians by Median Family Income
In terms of median family income, the demographic groups most similar to Romanians are Austrian ($111,306, a difference of 0.060%), Croatian ($111,370, a difference of 0.11%), Ukrainian ($111,368, a difference of 0.11%), Immigrants from Hungary ($111,378, a difference of 0.12%), and Immigrants from Argentina ($110,873, a difference of 0.33%).
| Demographics | Rating | Rank | Median Family Income |
| Immigrants | North America | 99.2 /100 | #81 | Exceptional $112,151 |
| Immigrants | England | 99.2 /100 | #82 | Exceptional $112,038 |
| Immigrants | Egypt | 99.0 /100 | #83 | Exceptional $111,689 |
| Immigrants | Hungary | 98.8 /100 | #84 | Exceptional $111,378 |
| Croatians | 98.8 /100 | #85 | Exceptional $111,370 |
| Ukrainians | 98.8 /100 | #86 | Exceptional $111,368 |
| Austrians | 98.8 /100 | #87 | Exceptional $111,306 |
| Romanians | 98.8 /100 | #88 | Exceptional $111,243 |
| Immigrants | Argentina | 98.5 /100 | #89 | Exceptional $110,873 |
| Northern Europeans | 98.3 /100 | #90 | Exceptional $110,635 |
| Immigrants | Southern Europe | 98.3 /100 | #91 | Exceptional $110,614 |
| Immigrants | Lebanon | 97.9 /100 | #92 | Exceptional $110,159 |
| Immigrants | Kazakhstan | 97.8 /100 | #93 | Exceptional $110,137 |
| Koreans | 97.8 /100 | #94 | Exceptional $110,103 |
| Zimbabweans | 97.7 /100 | #95 | Exceptional $110,011 |
Demographics Similar to Colombians by Median Family Income
In terms of median family income, the demographic groups most similar to Colombians are Immigrants from Kenya ($100,679, a difference of 0.070%), Iraqi ($100,658, a difference of 0.090%), Uruguayan ($100,656, a difference of 0.090%), Immigrants ($100,962, a difference of 0.21%), and Immigrants from Portugal ($100,984, a difference of 0.23%).
| Demographics | Rating | Rank | Median Family Income |
| Immigrants | Costa Rica | 33.7 /100 | #184 | Fair $101,354 |
| Dutch | 31.9 /100 | #185 | Fair $101,192 |
| Celtics | 31.3 /100 | #186 | Fair $101,139 |
| Tlingit-Haida | 30.8 /100 | #187 | Fair $101,092 |
| Guamanians/Chamorros | 30.5 /100 | #188 | Fair $101,061 |
| Immigrants | Portugal | 29.6 /100 | #189 | Fair $100,984 |
| Immigrants | Immigrants | 29.4 /100 | #190 | Fair $100,962 |
| Colombians | 27.2 /100 | #191 | Fair $100,750 |
| Immigrants | Kenya | 26.5 /100 | #192 | Fair $100,679 |
| Iraqis | 26.3 /100 | #193 | Fair $100,658 |
| Uruguayans | 26.3 /100 | #194 | Fair $100,656 |
| Immigrants | South America | 23.9 /100 | #195 | Fair $100,414 |
| Samoans | 23.3 /100 | #196 | Fair $100,344 |
| Immigrants | Cameroon | 22.8 /100 | #197 | Fair $100,289 |
| Immigrants | Africa | 22.5 /100 | #198 | Fair $100,256 |