Yaqui vs Immigrants from Thailand Median Family Income
COMPARE
Yaqui
Immigrants from Thailand
Median Family Income
Median Family Income Comparison
Yaqui
Immigrants from Thailand
$87,289
MEDIAN FAMILY INCOME
0.0/ 100
METRIC RATING
295th/ 347
METRIC RANK
$99,840
MEDIAN FAMILY INCOME
19.0/ 100
METRIC RATING
201st/ 347
METRIC RANK
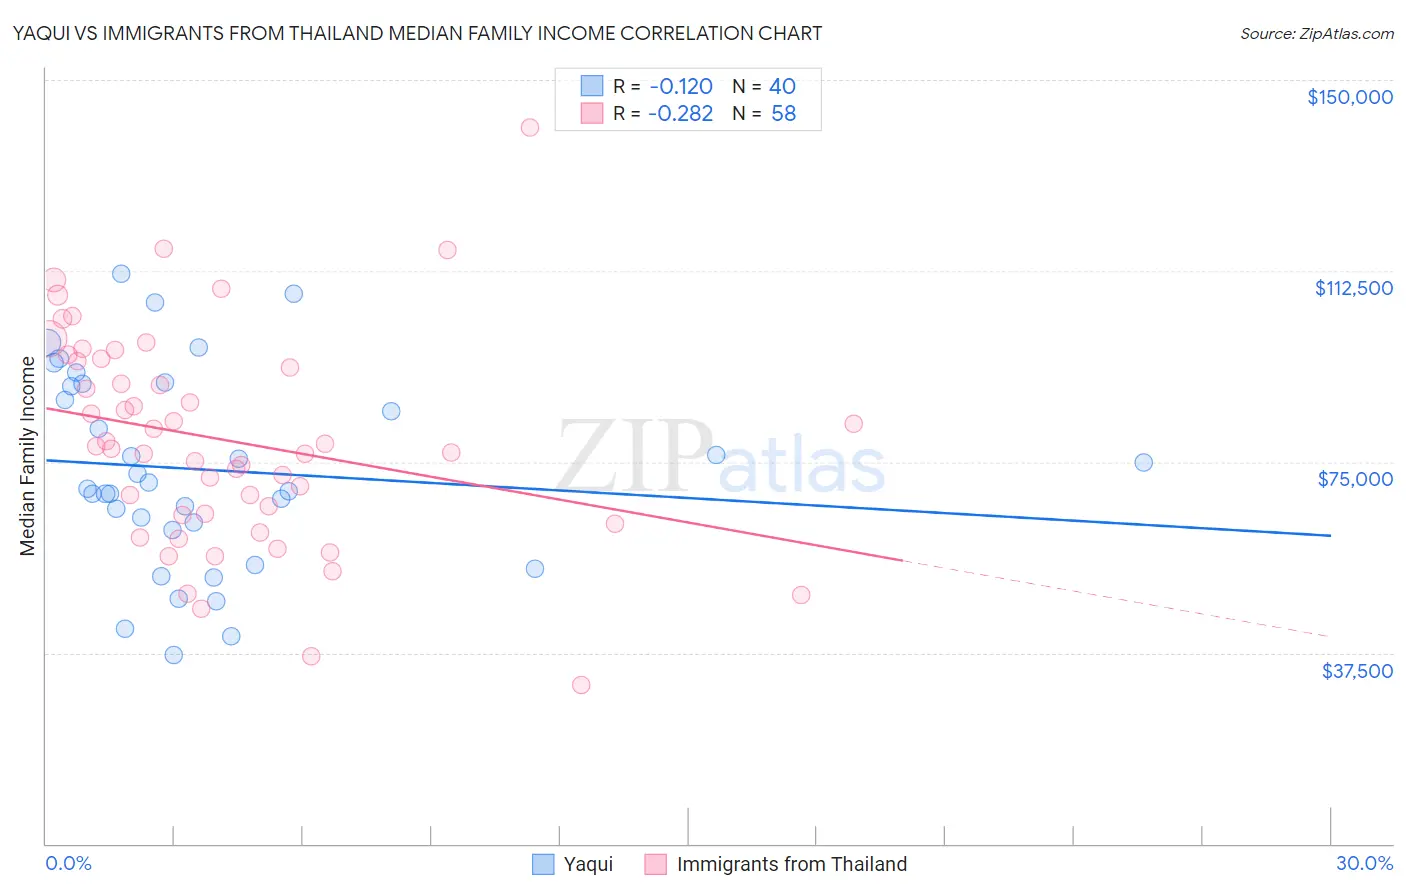
Yaqui vs Immigrants from Thailand Median Family Income Correlation Chart
The statistical analysis conducted on geographies consisting of 107,704,504 people shows a poor negative correlation between the proportion of Yaqui and median family income in the United States with a correlation coefficient (R) of -0.120 and weighted average of $87,289. Similarly, the statistical analysis conducted on geographies consisting of 316,887,320 people shows a weak negative correlation between the proportion of Immigrants from Thailand and median family income in the United States with a correlation coefficient (R) of -0.282 and weighted average of $99,840, a difference of 14.4%.
Median Family Income Correlation Summary
| Measurement | Yaqui | Immigrants from Thailand |
| Minimum | $37,174 | $31,250 |
| Maximum | $111,841 | $140,711 |
| Range | $74,667 | $109,461 |
| Mean | $73,462 | $79,142 |
| Median | $70,310 | $77,801 |
| Interquartile 25% (IQ1) | $62,336 | $64,533 |
| Interquartile 75% (IQ3) | $90,136 | $94,707 |
| Interquartile Range (IQR) | $27,800 | $30,174 |
| Standard Deviation (Sample) | $19,183 | $21,144 |
| Standard Deviation (Population) | $18,942 | $20,961 |
Similar Demographics by Median Family Income
Demographics Similar to Yaqui by Median Family Income
In terms of median family income, the demographic groups most similar to Yaqui are Fijian ($87,387, a difference of 0.11%), Immigrants from Guatemala ($87,191, a difference of 0.11%), Cajun ($87,157, a difference of 0.15%), Immigrants from Latin America ($86,989, a difference of 0.34%), and Ute ($87,596, a difference of 0.35%).
| Demographics | Rating | Rank | Median Family Income |
| Cherokee | 0.1 /100 | #288 | Tragic $88,209 |
| Central American Indians | 0.1 /100 | #289 | Tragic $88,034 |
| Shoshone | 0.1 /100 | #290 | Tragic $87,872 |
| Immigrants | Cabo Verde | 0.1 /100 | #291 | Tragic $87,830 |
| Africans | 0.1 /100 | #292 | Tragic $87,820 |
| Ute | 0.0 /100 | #293 | Tragic $87,596 |
| Fijians | 0.0 /100 | #294 | Tragic $87,387 |
| Yaqui | 0.0 /100 | #295 | Tragic $87,289 |
| Immigrants | Guatemala | 0.0 /100 | #296 | Tragic $87,191 |
| Cajuns | 0.0 /100 | #297 | Tragic $87,157 |
| Immigrants | Latin America | 0.0 /100 | #298 | Tragic $86,989 |
| Chippewa | 0.0 /100 | #299 | Tragic $86,852 |
| Ottawa | 0.0 /100 | #300 | Tragic $86,380 |
| Colville | 0.0 /100 | #301 | Tragic $85,792 |
| Spanish American Indians | 0.0 /100 | #302 | Tragic $85,728 |
Demographics Similar to Immigrants from Thailand by Median Family Income
In terms of median family income, the demographic groups most similar to Immigrants from Thailand are White/Caucasian ($99,800, a difference of 0.040%), Spanish ($99,977, a difference of 0.14%), Scotch-Irish ($99,591, a difference of 0.25%), Yugoslavian ($100,119, a difference of 0.28%), and Immigrants from Africa ($100,256, a difference of 0.42%).
| Demographics | Rating | Rank | Median Family Income |
| Uruguayans | 26.3 /100 | #194 | Fair $100,656 |
| Immigrants | South America | 23.9 /100 | #195 | Fair $100,414 |
| Samoans | 23.3 /100 | #196 | Fair $100,344 |
| Immigrants | Cameroon | 22.8 /100 | #197 | Fair $100,289 |
| Immigrants | Africa | 22.5 /100 | #198 | Fair $100,256 |
| Yugoslavians | 21.3 /100 | #199 | Fair $100,119 |
| Spanish | 20.1 /100 | #200 | Fair $99,977 |
| Immigrants | Thailand | 19.0 /100 | #201 | Poor $99,840 |
| Whites/Caucasians | 18.7 /100 | #202 | Poor $99,800 |
| Scotch-Irish | 17.1 /100 | #203 | Poor $99,591 |
| Ghanaians | 12.6 /100 | #204 | Poor $98,877 |
| Hawaiians | 12.5 /100 | #205 | Poor $98,869 |
| Immigrants | Iraq | 12.1 /100 | #206 | Poor $98,786 |
| Aleuts | 11.6 /100 | #207 | Poor $98,702 |
| Immigrants | Uruguay | 9.2 /100 | #208 | Tragic $98,205 |