Welsh vs Palestinian Wage/Income Gap
COMPARE
Welsh
Palestinian
Wage/Income Gap
Wage/Income Gap Comparison
Welsh
Palestinians
28.9%
WAGE/INCOME GAP
0.1/ 100
METRIC RATING
321st/ 347
METRIC RANK
26.1%
WAGE/INCOME GAP
29.9/ 100
METRIC RATING
187th/ 347
METRIC RANK
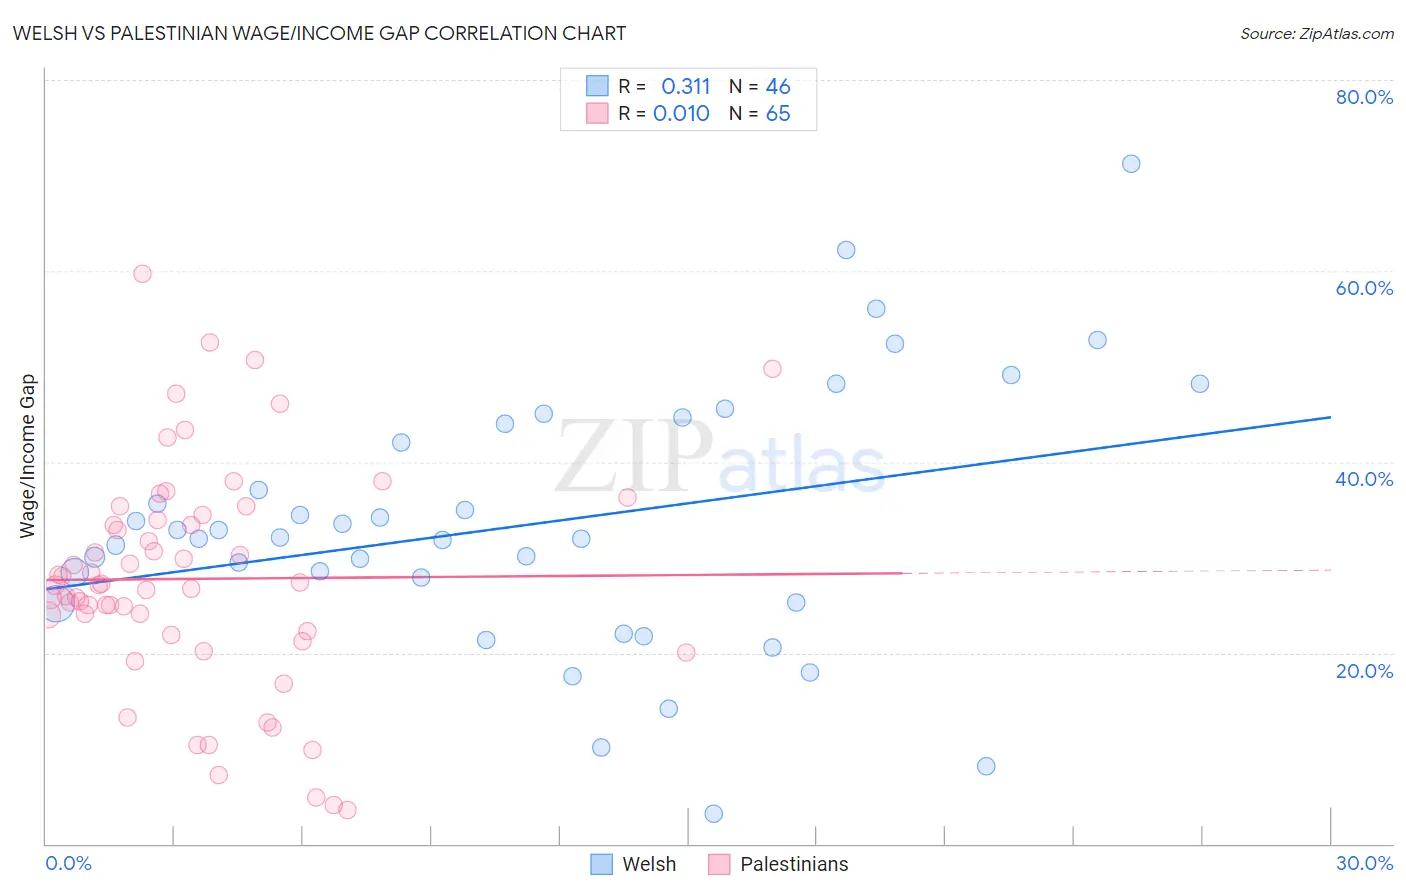
Welsh vs Palestinian Wage/Income Gap Correlation Chart
The statistical analysis conducted on geographies consisting of 527,078,541 people shows a mild positive correlation between the proportion of Welsh and wage/income gap percentage in the United States with a correlation coefficient (R) of 0.311 and weighted average of 28.9%. Similarly, the statistical analysis conducted on geographies consisting of 216,443,706 people shows no correlation between the proportion of Palestinians and wage/income gap percentage in the United States with a correlation coefficient (R) of 0.010 and weighted average of 26.1%, a difference of 10.7%.
Wage/Income Gap Correlation Summary
| Measurement | Welsh | Palestinian |
| Minimum | 3.1% | 3.6% |
| Maximum | 71.2% | 59.7% |
| Range | 68.1% | 56.1% |
| Mean | 33.5% | 27.8% |
| Median | 32.1% | 27.1% |
| Interquartile 25% (IQ1) | 25.2% | 22.0% |
| Interquartile 75% (IQ3) | 44.0% | 34.1% |
| Interquartile Range (IQR) | 18.8% | 12.1% |
| Standard Deviation (Sample) | 13.8% | 11.7% |
| Standard Deviation (Population) | 13.7% | 11.6% |
Similar Demographics by Wage/Income Gap
Demographics Similar to Welsh by Wage/Income Gap
In terms of wage/income gap, the demographic groups most similar to Welsh are Immigrants from Singapore (28.9%, a difference of 0.020%), British (28.9%, a difference of 0.070%), Slovak (28.9%, a difference of 0.13%), Norwegian (29.0%, a difference of 0.13%), and Croatian (29.0%, a difference of 0.25%).
| Demographics | Rating | Rank | Wage/Income Gap |
| Immigrants | Scotland | 0.1 /100 | #314 | Tragic 28.7% |
| Maltese | 0.1 /100 | #315 | Tragic 28.7% |
| Lithuanians | 0.1 /100 | #316 | Tragic 28.7% |
| Belgians | 0.1 /100 | #317 | Tragic 28.8% |
| Basques | 0.1 /100 | #318 | Tragic 28.8% |
| Slovaks | 0.1 /100 | #319 | Tragic 28.9% |
| British | 0.1 /100 | #320 | Tragic 28.9% |
| Welsh | 0.1 /100 | #321 | Tragic 28.9% |
| Immigrants | Singapore | 0.1 /100 | #322 | Tragic 28.9% |
| Norwegians | 0.1 /100 | #323 | Tragic 29.0% |
| Croatians | 0.0 /100 | #324 | Tragic 29.0% |
| Hungarians | 0.0 /100 | #325 | Tragic 29.0% |
| Immigrants | Belgium | 0.0 /100 | #326 | Tragic 29.0% |
| Immigrants | Iran | 0.0 /100 | #327 | Tragic 29.1% |
| Scandinavians | 0.0 /100 | #328 | Tragic 29.1% |
Demographics Similar to Palestinians by Wage/Income Gap
In terms of wage/income gap, the demographic groups most similar to Palestinians are Immigrants from Egypt (26.1%, a difference of 0.010%), Immigrants from Indonesia (26.1%, a difference of 0.19%), Immigrants from Moldova (26.2%, a difference of 0.26%), Pakistani (26.1%, a difference of 0.28%), and Mexican (26.0%, a difference of 0.33%).
| Demographics | Rating | Rank | Wage/Income Gap |
| Guamanians/Chamorros | 38.0 /100 | #180 | Fair 26.0% |
| Immigrants | Bolivia | 36.4 /100 | #181 | Fair 26.0% |
| Immigrants | Serbia | 35.4 /100 | #182 | Fair 26.0% |
| Immigrants | Kazakhstan | 35.2 /100 | #183 | Fair 26.0% |
| Mexicans | 34.4 /100 | #184 | Fair 26.0% |
| Pakistanis | 33.7 /100 | #185 | Fair 26.1% |
| Immigrants | Indonesia | 32.5 /100 | #186 | Fair 26.1% |
| Palestinians | 29.9 /100 | #187 | Fair 26.1% |
| Immigrants | Egypt | 29.9 /100 | #188 | Fair 26.1% |
| Immigrants | Moldova | 26.6 /100 | #189 | Fair 26.2% |
| Immigrants | Croatia | 24.8 /100 | #190 | Fair 26.2% |
| Immigrants | Venezuela | 24.7 /100 | #191 | Fair 26.2% |
| Immigrants | Bulgaria | 22.5 /100 | #192 | Fair 26.3% |
| Immigrants | Jordan | 22.4 /100 | #193 | Fair 26.3% |
| Chileans | 22.3 /100 | #194 | Fair 26.3% |