Welsh vs Immigrants from Philippines Wage/Income Gap
COMPARE
Welsh
Immigrants from Philippines
Wage/Income Gap
Wage/Income Gap Comparison
Welsh
Immigrants from Philippines
28.9%
WAGE/INCOME GAP
0.1/ 100
METRIC RATING
321st/ 347
METRIC RANK
24.7%
WAGE/INCOME GAP
93.0/ 100
METRIC RATING
131st/ 347
METRIC RANK
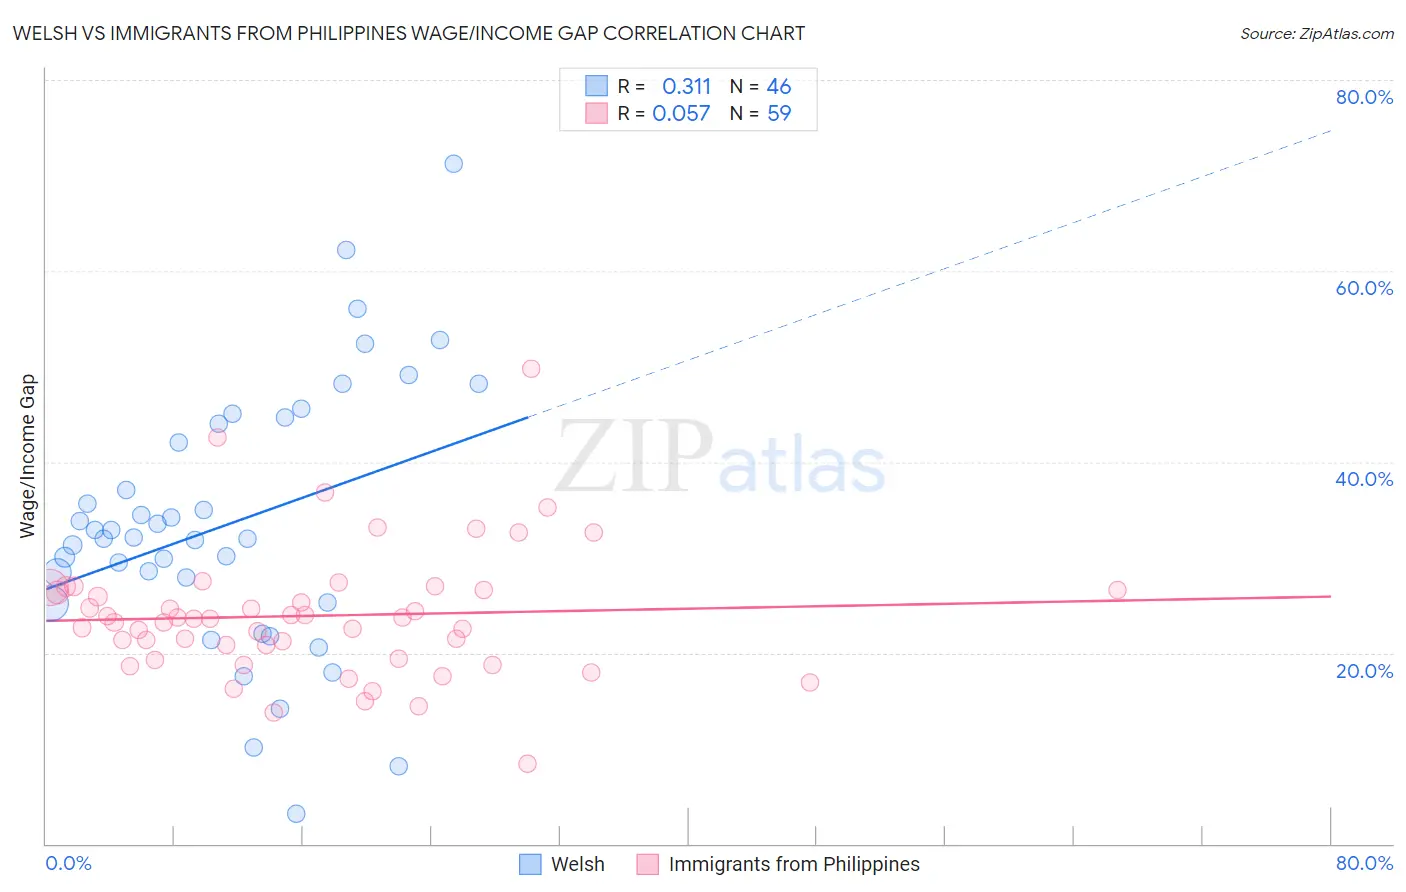
Welsh vs Immigrants from Philippines Wage/Income Gap Correlation Chart
The statistical analysis conducted on geographies consisting of 527,078,541 people shows a mild positive correlation between the proportion of Welsh and wage/income gap percentage in the United States with a correlation coefficient (R) of 0.311 and weighted average of 28.9%. Similarly, the statistical analysis conducted on geographies consisting of 470,842,100 people shows a slight positive correlation between the proportion of Immigrants from Philippines and wage/income gap percentage in the United States with a correlation coefficient (R) of 0.057 and weighted average of 24.7%, a difference of 17.1%.
Wage/Income Gap Correlation Summary
| Measurement | Welsh | Immigrants from Philippines |
| Minimum | 3.1% | 8.4% |
| Maximum | 71.2% | 49.7% |
| Range | 68.1% | 41.3% |
| Mean | 33.5% | 23.9% |
| Median | 32.1% | 23.5% |
| Interquartile 25% (IQ1) | 25.2% | 19.4% |
| Interquartile 75% (IQ3) | 44.0% | 26.6% |
| Interquartile Range (IQR) | 18.8% | 7.3% |
| Standard Deviation (Sample) | 13.8% | 6.8% |
| Standard Deviation (Population) | 13.7% | 6.8% |
Similar Demographics by Wage/Income Gap
Demographics Similar to Welsh by Wage/Income Gap
In terms of wage/income gap, the demographic groups most similar to Welsh are Immigrants from Singapore (28.9%, a difference of 0.020%), British (28.9%, a difference of 0.070%), Slovak (28.9%, a difference of 0.13%), Norwegian (29.0%, a difference of 0.13%), and Croatian (29.0%, a difference of 0.25%).
| Demographics | Rating | Rank | Wage/Income Gap |
| Immigrants | Scotland | 0.1 /100 | #314 | Tragic 28.7% |
| Maltese | 0.1 /100 | #315 | Tragic 28.7% |
| Lithuanians | 0.1 /100 | #316 | Tragic 28.7% |
| Belgians | 0.1 /100 | #317 | Tragic 28.8% |
| Basques | 0.1 /100 | #318 | Tragic 28.8% |
| Slovaks | 0.1 /100 | #319 | Tragic 28.9% |
| British | 0.1 /100 | #320 | Tragic 28.9% |
| Welsh | 0.1 /100 | #321 | Tragic 28.9% |
| Immigrants | Singapore | 0.1 /100 | #322 | Tragic 28.9% |
| Norwegians | 0.1 /100 | #323 | Tragic 29.0% |
| Croatians | 0.0 /100 | #324 | Tragic 29.0% |
| Hungarians | 0.0 /100 | #325 | Tragic 29.0% |
| Immigrants | Belgium | 0.0 /100 | #326 | Tragic 29.0% |
| Immigrants | Iran | 0.0 /100 | #327 | Tragic 29.1% |
| Scandinavians | 0.0 /100 | #328 | Tragic 29.1% |
Demographics Similar to Immigrants from Philippines by Wage/Income Gap
In terms of wage/income gap, the demographic groups most similar to Immigrants from Philippines are Alsatian (24.7%, a difference of 0.070%), Yup'ik (24.7%, a difference of 0.090%), Immigrants from Central America (24.6%, a difference of 0.15%), Immigrants from Costa Rica (24.7%, a difference of 0.15%), and Colombian (24.7%, a difference of 0.15%).
| Demographics | Rating | Rank | Wage/Income Gap |
| Immigrants | South America | 93.9 /100 | #124 | Exceptional 24.6% |
| Spanish Americans | 93.8 /100 | #125 | Exceptional 24.6% |
| Immigrants | Uruguay | 93.8 /100 | #126 | Exceptional 24.6% |
| German Russians | 93.7 /100 | #127 | Exceptional 24.6% |
| Immigrants | Central America | 93.5 /100 | #128 | Exceptional 24.6% |
| Yup'ik | 93.3 /100 | #129 | Exceptional 24.7% |
| Alsatians | 93.2 /100 | #130 | Exceptional 24.7% |
| Immigrants | Philippines | 93.0 /100 | #131 | Exceptional 24.7% |
| Immigrants | Costa Rica | 92.4 /100 | #132 | Exceptional 24.7% |
| Colombians | 92.4 /100 | #133 | Exceptional 24.7% |
| Mexican American Indians | 92.2 /100 | #134 | Exceptional 24.7% |
| South American Indians | 92.0 /100 | #135 | Exceptional 24.7% |
| Armenians | 91.3 /100 | #136 | Exceptional 24.8% |
| Immigrants | South Eastern Asia | 90.9 /100 | #137 | Exceptional 24.8% |
| Immigrants | Bosnia and Herzegovina | 90.1 /100 | #138 | Exceptional 24.8% |