Seminole vs Palestinian Wage/Income Gap
COMPARE
Seminole
Palestinian
Wage/Income Gap
Wage/Income Gap Comparison
Seminole
Palestinians
25.6%
WAGE/INCOME GAP
62.6/ 100
METRIC RATING
168th/ 347
METRIC RANK
26.1%
WAGE/INCOME GAP
29.9/ 100
METRIC RATING
187th/ 347
METRIC RANK
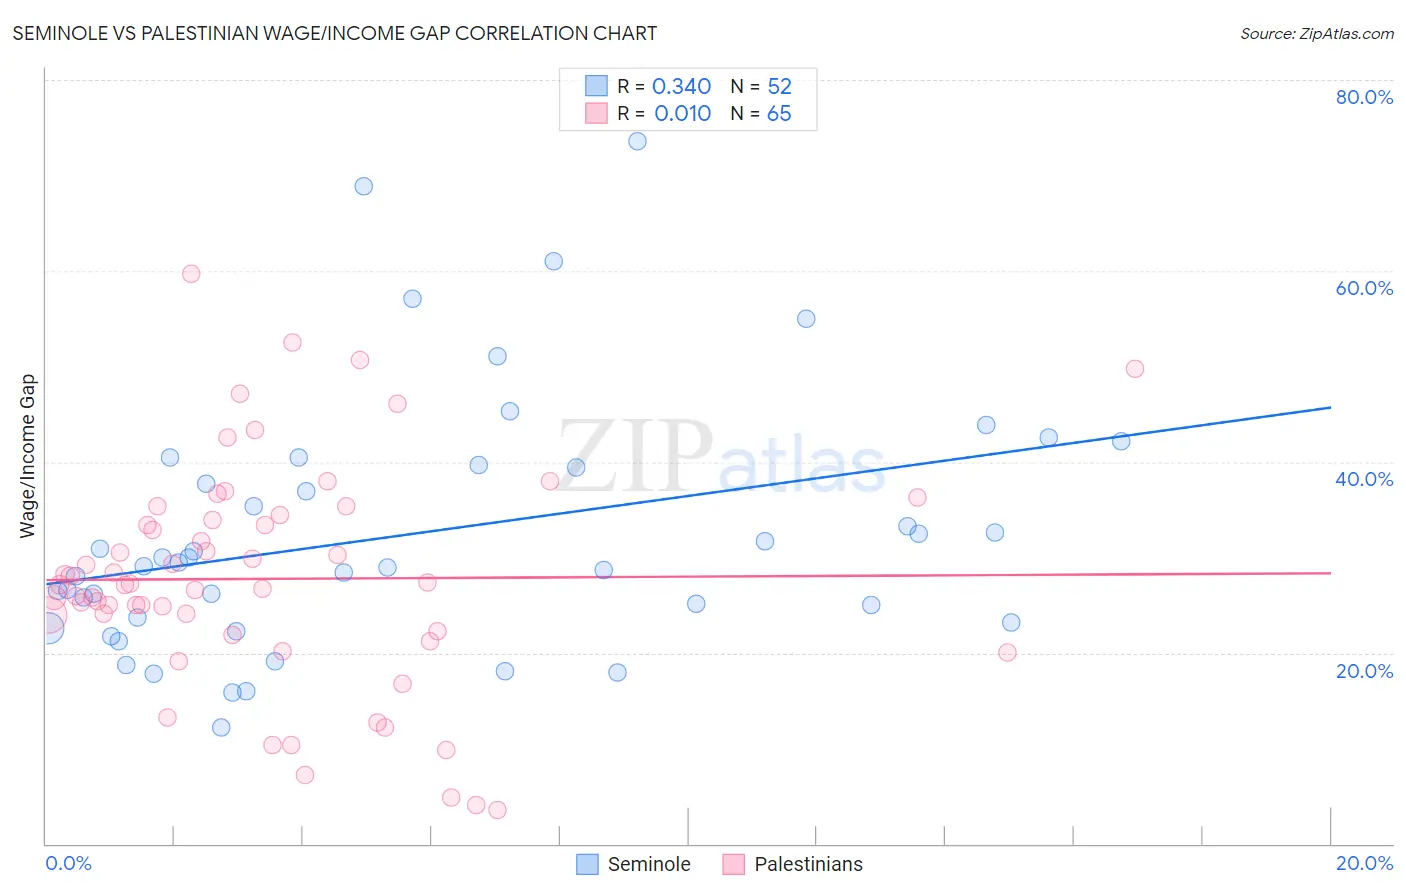
Seminole vs Palestinian Wage/Income Gap Correlation Chart
The statistical analysis conducted on geographies consisting of 118,242,273 people shows a mild positive correlation between the proportion of Seminole and wage/income gap percentage in the United States with a correlation coefficient (R) of 0.340 and weighted average of 25.6%. Similarly, the statistical analysis conducted on geographies consisting of 216,443,706 people shows no correlation between the proportion of Palestinians and wage/income gap percentage in the United States with a correlation coefficient (R) of 0.010 and weighted average of 26.1%, a difference of 2.2%.
Wage/Income Gap Correlation Summary
| Measurement | Seminole | Palestinian |
| Minimum | 12.2% | 3.6% |
| Maximum | 73.6% | 59.7% |
| Range | 61.3% | 56.1% |
| Mean | 32.4% | 27.8% |
| Median | 29.3% | 27.1% |
| Interquartile 25% (IQ1) | 23.5% | 22.0% |
| Interquartile 75% (IQ3) | 39.5% | 34.1% |
| Interquartile Range (IQR) | 16.1% | 12.1% |
| Standard Deviation (Sample) | 13.3% | 11.7% |
| Standard Deviation (Population) | 13.2% | 11.6% |
Demographics Similar to Seminole and Palestinians by Wage/Income Gap
In terms of wage/income gap, the demographic groups most similar to Seminole are Paiute (25.5%, a difference of 0.020%), Peruvian (25.6%, a difference of 0.18%), Immigrants from Oceania (25.6%, a difference of 0.35%), Immigrants from Greece (25.7%, a difference of 0.41%), and Immigrants from Chile (25.7%, a difference of 0.64%). Similarly, the demographic groups most similar to Palestinians are Immigrants from Indonesia (26.1%, a difference of 0.19%), Pakistani (26.1%, a difference of 0.28%), Mexican (26.0%, a difference of 0.33%), Immigrants from Kazakhstan (26.0%, a difference of 0.39%), and Immigrants from Serbia (26.0%, a difference of 0.40%).
| Demographics | Rating | Rank | Wage/Income Gap |
| Paiute | 62.9 /100 | #167 | Good 25.5% |
| Seminole | 62.6 /100 | #168 | Good 25.6% |
| Peruvians | 60.1 /100 | #169 | Good 25.6% |
| Immigrants | Oceania | 57.5 /100 | #170 | Average 25.6% |
| Immigrants | Greece | 56.6 /100 | #171 | Average 25.7% |
| Immigrants | Chile | 53.2 /100 | #172 | Average 25.7% |
| Immigrants | Belarus | 52.9 /100 | #173 | Average 25.7% |
| Alaskan Athabascans | 50.0 /100 | #174 | Average 25.8% |
| Sri Lankans | 47.0 /100 | #175 | Average 25.8% |
| Paraguayans | 46.7 /100 | #176 | Average 25.8% |
| Cambodians | 45.1 /100 | #177 | Average 25.8% |
| Chinese | 42.0 /100 | #178 | Average 25.9% |
| Samoans | 38.6 /100 | #179 | Fair 26.0% |
| Guamanians/Chamorros | 38.0 /100 | #180 | Fair 26.0% |
| Immigrants | Bolivia | 36.4 /100 | #181 | Fair 26.0% |
| Immigrants | Serbia | 35.4 /100 | #182 | Fair 26.0% |
| Immigrants | Kazakhstan | 35.2 /100 | #183 | Fair 26.0% |
| Mexicans | 34.4 /100 | #184 | Fair 26.0% |
| Pakistanis | 33.7 /100 | #185 | Fair 26.1% |
| Immigrants | Indonesia | 32.5 /100 | #186 | Fair 26.1% |
| Palestinians | 29.9 /100 | #187 | Fair 26.1% |