Polish vs Immigrants from Philippines Wage/Income Gap
COMPARE
Polish
Immigrants from Philippines
Wage/Income Gap
Wage/Income Gap Comparison
Poles
Immigrants from Philippines
28.5%
WAGE/INCOME GAP
0.1/ 100
METRIC RATING
308th/ 347
METRIC RANK
24.7%
WAGE/INCOME GAP
93.0/ 100
METRIC RATING
131st/ 347
METRIC RANK
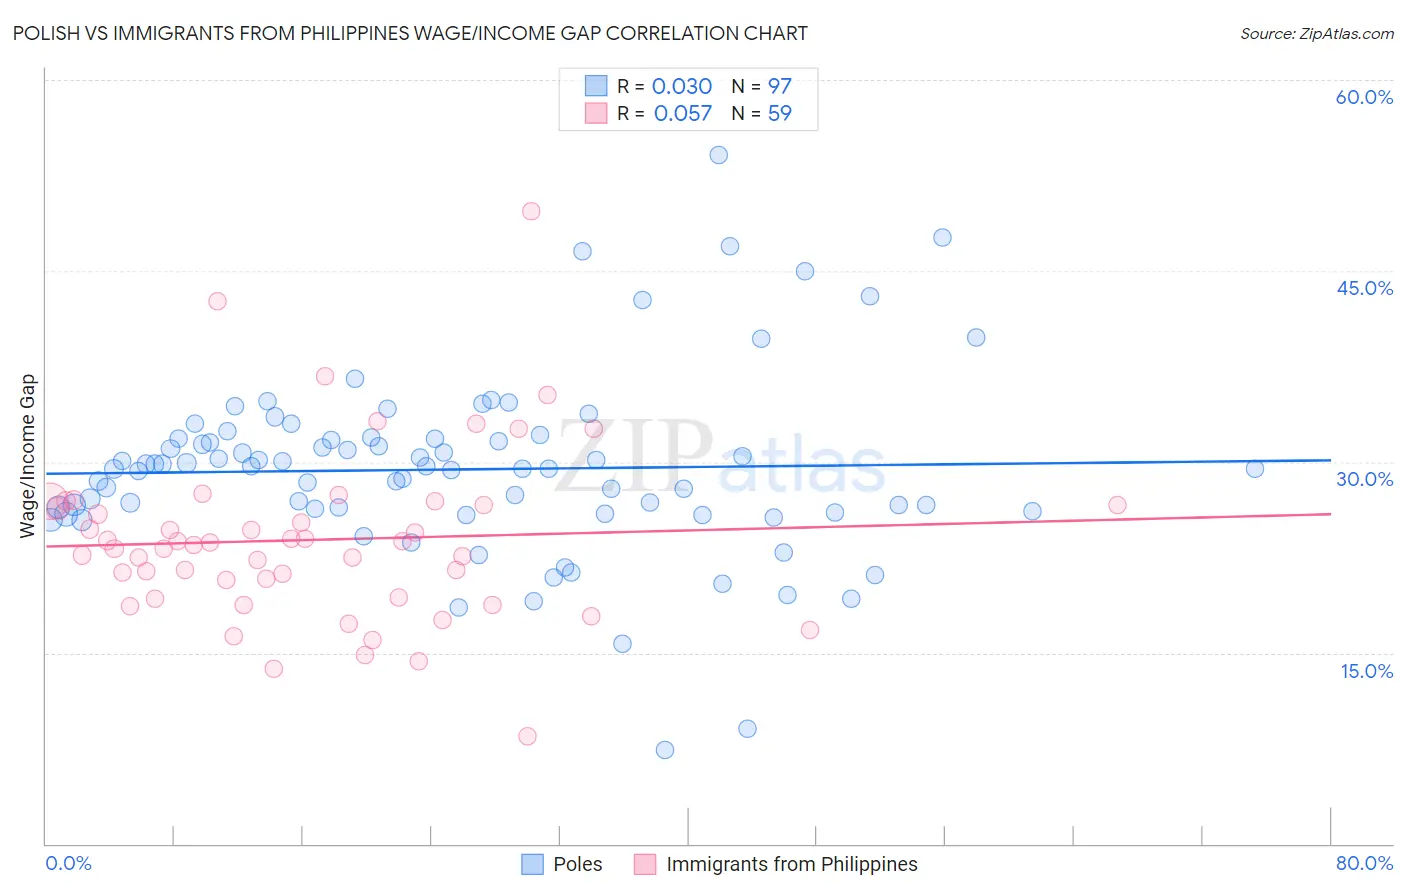
Polish vs Immigrants from Philippines Wage/Income Gap Correlation Chart
The statistical analysis conducted on geographies consisting of 558,332,968 people shows no correlation between the proportion of Poles and wage/income gap percentage in the United States with a correlation coefficient (R) of 0.030 and weighted average of 28.5%. Similarly, the statistical analysis conducted on geographies consisting of 470,842,100 people shows a slight positive correlation between the proportion of Immigrants from Philippines and wage/income gap percentage in the United States with a correlation coefficient (R) of 0.057 and weighted average of 24.7%, a difference of 15.6%.
Wage/Income Gap Correlation Summary
| Measurement | Polish | Immigrants from Philippines |
| Minimum | 7.4% | 8.4% |
| Maximum | 54.1% | 49.7% |
| Range | 46.7% | 41.3% |
| Mean | 29.4% | 23.9% |
| Median | 29.5% | 23.5% |
| Interquartile 25% (IQ1) | 26.1% | 19.4% |
| Interquartile 75% (IQ3) | 31.8% | 26.6% |
| Interquartile Range (IQR) | 5.7% | 7.3% |
| Standard Deviation (Sample) | 7.2% | 6.8% |
| Standard Deviation (Population) | 7.1% | 6.8% |
Similar Demographics by Wage/Income Gap
Demographics Similar to Poles by Wage/Income Gap
In terms of wage/income gap, the demographic groups most similar to Poles are Immigrants from Denmark (28.5%, a difference of 0.070%), White/Caucasian (28.5%, a difference of 0.080%), Macedonian (28.6%, a difference of 0.090%), Immigrants from South Africa (28.5%, a difference of 0.13%), and Immigrants from Netherlands (28.5%, a difference of 0.14%).
| Demographics | Rating | Rank | Wage/Income Gap |
| Immigrants | Canada | 0.2 /100 | #301 | Tragic 28.5% |
| Scotch-Irish | 0.2 /100 | #302 | Tragic 28.5% |
| Irish | 0.2 /100 | #303 | Tragic 28.5% |
| Immigrants | Netherlands | 0.2 /100 | #304 | Tragic 28.5% |
| Immigrants | South Africa | 0.1 /100 | #305 | Tragic 28.5% |
| Whites/Caucasians | 0.1 /100 | #306 | Tragic 28.5% |
| Immigrants | Denmark | 0.1 /100 | #307 | Tragic 28.5% |
| Poles | 0.1 /100 | #308 | Tragic 28.5% |
| Macedonians | 0.1 /100 | #309 | Tragic 28.6% |
| Finns | 0.1 /100 | #310 | Tragic 28.6% |
| Immigrants | Lithuania | 0.1 /100 | #311 | Tragic 28.6% |
| Eastern Europeans | 0.1 /100 | #312 | Tragic 28.6% |
| French | 0.1 /100 | #313 | Tragic 28.7% |
| Immigrants | Scotland | 0.1 /100 | #314 | Tragic 28.7% |
| Maltese | 0.1 /100 | #315 | Tragic 28.7% |
Demographics Similar to Immigrants from Philippines by Wage/Income Gap
In terms of wage/income gap, the demographic groups most similar to Immigrants from Philippines are Alsatian (24.7%, a difference of 0.070%), Yup'ik (24.7%, a difference of 0.090%), Immigrants from Central America (24.6%, a difference of 0.15%), Immigrants from Costa Rica (24.7%, a difference of 0.15%), and Colombian (24.7%, a difference of 0.15%).
| Demographics | Rating | Rank | Wage/Income Gap |
| Immigrants | South America | 93.9 /100 | #124 | Exceptional 24.6% |
| Spanish Americans | 93.8 /100 | #125 | Exceptional 24.6% |
| Immigrants | Uruguay | 93.8 /100 | #126 | Exceptional 24.6% |
| German Russians | 93.7 /100 | #127 | Exceptional 24.6% |
| Immigrants | Central America | 93.5 /100 | #128 | Exceptional 24.6% |
| Yup'ik | 93.3 /100 | #129 | Exceptional 24.7% |
| Alsatians | 93.2 /100 | #130 | Exceptional 24.7% |
| Immigrants | Philippines | 93.0 /100 | #131 | Exceptional 24.7% |
| Immigrants | Costa Rica | 92.4 /100 | #132 | Exceptional 24.7% |
| Colombians | 92.4 /100 | #133 | Exceptional 24.7% |
| Mexican American Indians | 92.2 /100 | #134 | Exceptional 24.7% |
| South American Indians | 92.0 /100 | #135 | Exceptional 24.7% |
| Armenians | 91.3 /100 | #136 | Exceptional 24.8% |
| Immigrants | South Eastern Asia | 90.9 /100 | #137 | Exceptional 24.8% |
| Immigrants | Bosnia and Herzegovina | 90.1 /100 | #138 | Exceptional 24.8% |