Russian vs Immigrants from Korea Median Household Income
COMPARE
Russian
Immigrants from Korea
Median Household Income
Median Household Income Comparison
Russians
Immigrants from Korea
$98,008
MEDIAN HOUSEHOLD INCOME
100.0/ 100
METRIC RATING
34th/ 347
METRIC RANK
$102,962
MEDIAN HOUSEHOLD INCOME
100.0/ 100
METRIC RATING
17th/ 347
METRIC RANK
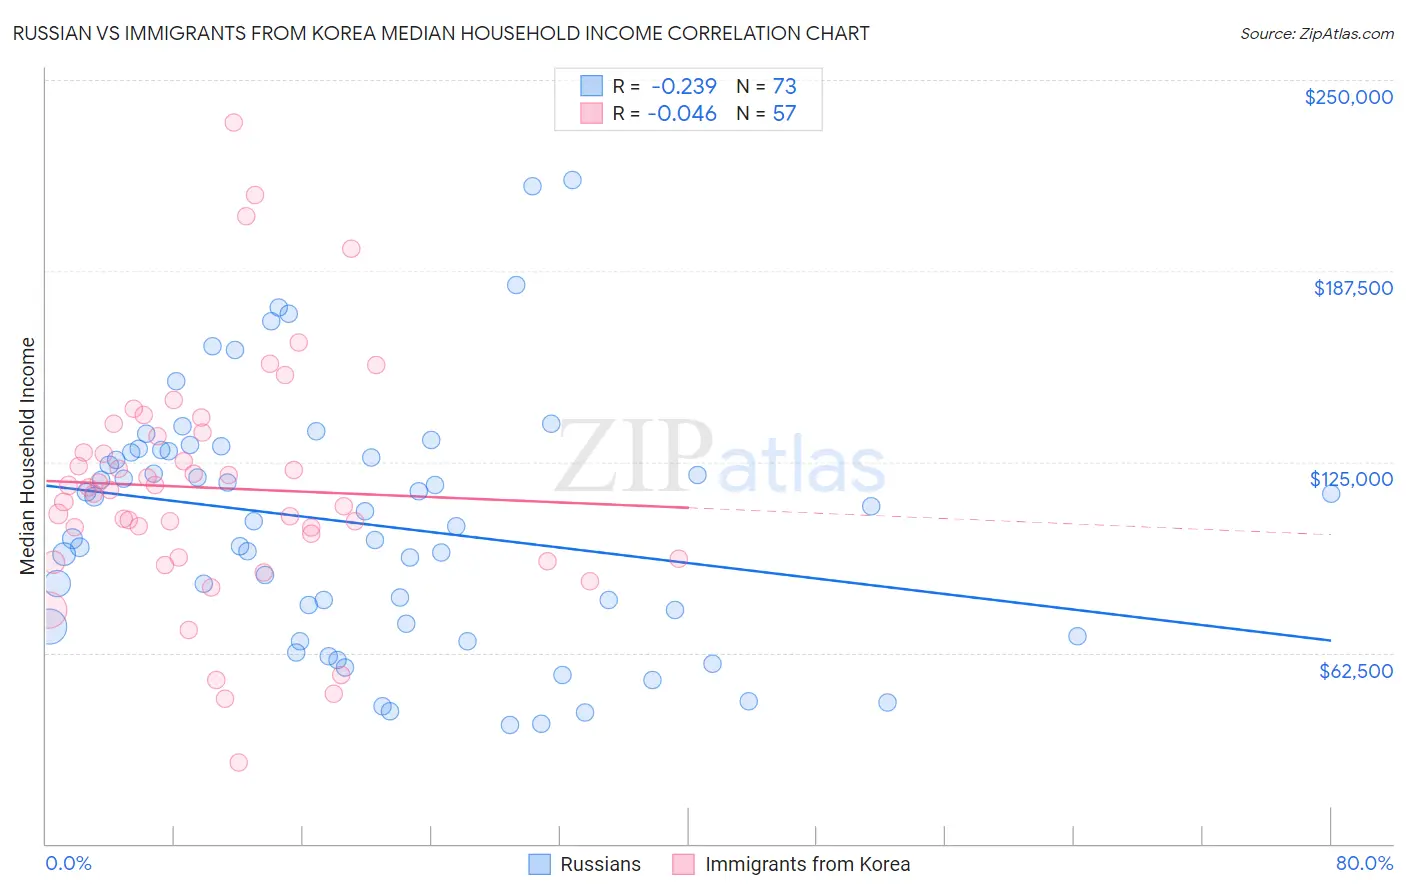
Russian vs Immigrants from Korea Median Household Income Correlation Chart
The statistical analysis conducted on geographies consisting of 511,515,990 people shows a weak negative correlation between the proportion of Russians and median household income in the United States with a correlation coefficient (R) of -0.239 and weighted average of $98,008. Similarly, the statistical analysis conducted on geographies consisting of 415,854,714 people shows no correlation between the proportion of Immigrants from Korea and median household income in the United States with a correlation coefficient (R) of -0.046 and weighted average of $102,962, a difference of 5.1%.
Median Household Income Correlation Summary
| Measurement | Russian | Immigrants from Korea |
| Minimum | $38,750 | $26,550 |
| Maximum | $217,375 | $235,959 |
| Range | $178,625 | $209,409 |
| Mean | $104,714 | $116,491 |
| Median | $105,523 | $115,968 |
| Interquartile 25% (IQ1) | $71,539 | $93,452 |
| Interquartile 75% (IQ3) | $128,679 | $133,881 |
| Interquartile Range (IQR) | $57,140 | $40,429 |
| Standard Deviation (Sample) | $40,584 | $38,811 |
| Standard Deviation (Population) | $40,305 | $38,469 |
Demographics Similar to Russians and Immigrants from Korea by Median Household Income
In terms of median household income, the demographic groups most similar to Russians are Immigrants from Switzerland ($97,979, a difference of 0.030%), Chinese ($98,496, a difference of 0.50%), Immigrants from Denmark ($98,510, a difference of 0.51%), Turkish ($99,389, a difference of 1.4%), and Immigrants from Northern Europe ($99,813, a difference of 1.8%). Similarly, the demographic groups most similar to Immigrants from Korea are Cypriot ($102,843, a difference of 0.12%), Burmese ($103,145, a difference of 0.18%), Immigrants from Australia ($102,562, a difference of 0.39%), Bolivian ($102,195, a difference of 0.75%), and Immigrants from Israel ($104,090, a difference of 1.1%).
| Demographics | Rating | Rank | Median Household Income |
| Immigrants | Israel | 100.0 /100 | #15 | Exceptional $104,090 |
| Burmese | 100.0 /100 | #16 | Exceptional $103,145 |
| Immigrants | Korea | 100.0 /100 | #17 | Exceptional $102,962 |
| Cypriots | 100.0 /100 | #18 | Exceptional $102,843 |
| Immigrants | Australia | 100.0 /100 | #19 | Exceptional $102,562 |
| Bolivians | 100.0 /100 | #20 | Exceptional $102,195 |
| Eastern Europeans | 100.0 /100 | #21 | Exceptional $101,781 |
| Asians | 100.0 /100 | #22 | Exceptional $101,681 |
| Immigrants | Bolivia | 100.0 /100 | #23 | Exceptional $101,394 |
| Immigrants | Japan | 100.0 /100 | #24 | Exceptional $100,711 |
| Immigrants | Sweden | 100.0 /100 | #25 | Exceptional $100,699 |
| Immigrants | Belgium | 100.0 /100 | #26 | Exceptional $100,306 |
| Bhutanese | 100.0 /100 | #27 | Exceptional $100,151 |
| Immigrants | Sri Lanka | 100.0 /100 | #28 | Exceptional $99,943 |
| Immigrants | Asia | 100.0 /100 | #29 | Exceptional $99,933 |
| Immigrants | Northern Europe | 100.0 /100 | #30 | Exceptional $99,813 |
| Turks | 100.0 /100 | #31 | Exceptional $99,389 |
| Immigrants | Denmark | 100.0 /100 | #32 | Exceptional $98,510 |
| Chinese | 100.0 /100 | #33 | Exceptional $98,496 |
| Russians | 100.0 /100 | #34 | Exceptional $98,008 |
| Immigrants | Switzerland | 100.0 /100 | #35 | Exceptional $97,979 |