Immigrants from Scotland vs Immigrants from Egypt Median Family Income
COMPARE
Immigrants from Scotland
Immigrants from Egypt
Median Family Income
Median Family Income Comparison
Immigrants from Scotland
Immigrants from Egypt
$114,392
MEDIAN FAMILY INCOME
99.7/ 100
METRIC RATING
64th/ 347
METRIC RANK
$111,689
MEDIAN FAMILY INCOME
99.0/ 100
METRIC RATING
83rd/ 347
METRIC RANK
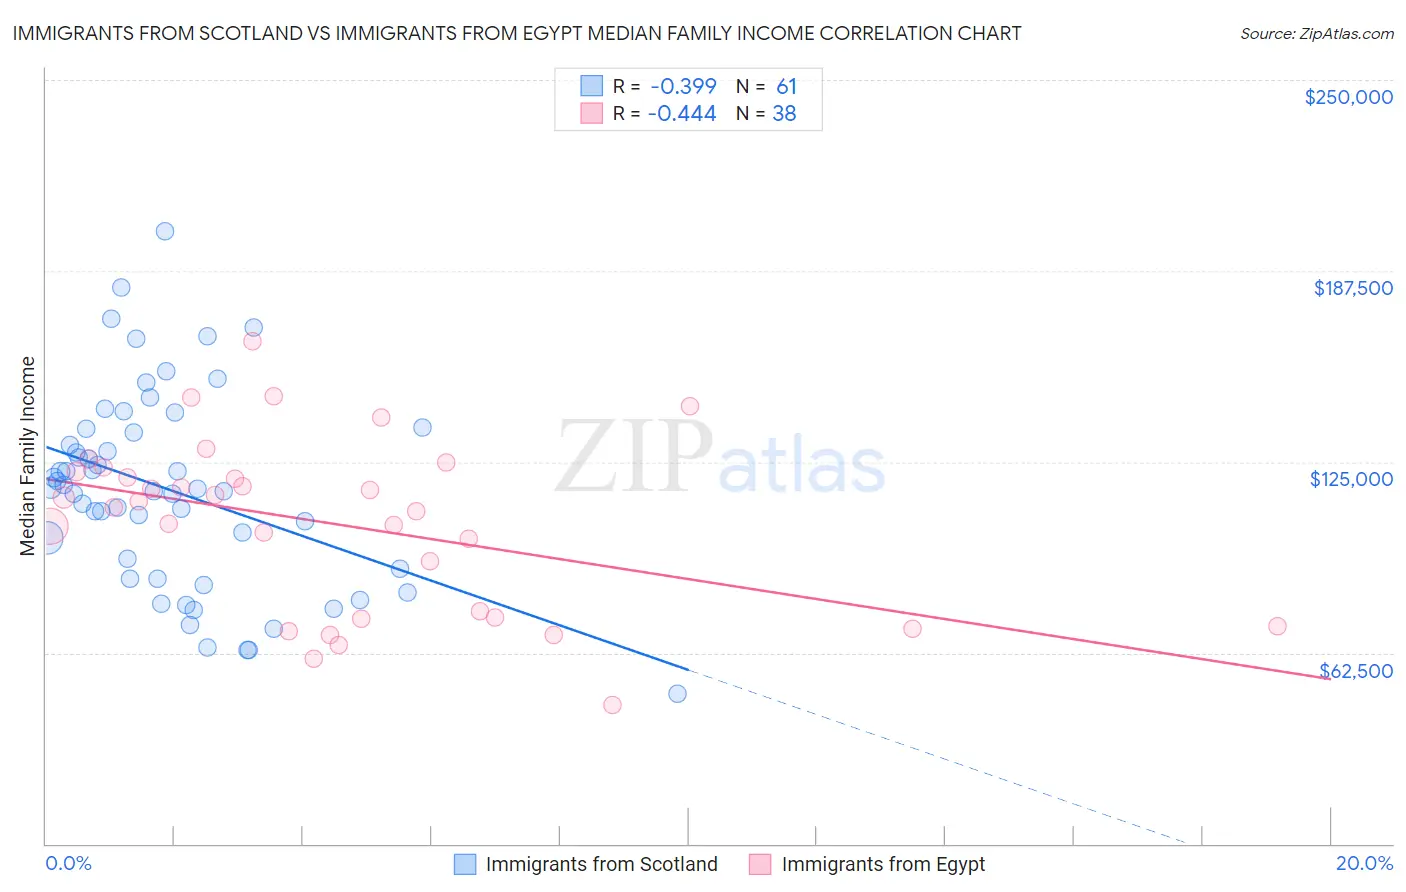
Immigrants from Scotland vs Immigrants from Egypt Median Family Income Correlation Chart
The statistical analysis conducted on geographies consisting of 196,366,880 people shows a mild negative correlation between the proportion of Immigrants from Scotland and median family income in the United States with a correlation coefficient (R) of -0.399 and weighted average of $114,392. Similarly, the statistical analysis conducted on geographies consisting of 245,384,191 people shows a moderate negative correlation between the proportion of Immigrants from Egypt and median family income in the United States with a correlation coefficient (R) of -0.444 and weighted average of $111,689, a difference of 2.4%.
Median Family Income Correlation Summary
| Measurement | Immigrants from Scotland | Immigrants from Egypt |
| Minimum | $48,950 | $45,581 |
| Maximum | $200,376 | $164,298 |
| Range | $151,426 | $118,717 |
| Mean | $115,583 | $104,674 |
| Median | $116,250 | $111,132 |
| Interquartile 25% (IQ1) | $88,375 | $74,063 |
| Interquartile 75% (IQ3) | $135,291 | $122,004 |
| Interquartile Range (IQR) | $46,916 | $47,941 |
| Standard Deviation (Sample) | $31,941 | $28,077 |
| Standard Deviation (Population) | $31,678 | $27,705 |
Demographics Similar to Immigrants from Scotland and Immigrants from Egypt by Median Family Income
In terms of median family income, the demographic groups most similar to Immigrants from Scotland are Immigrants from Pakistan ($114,406, a difference of 0.010%), Egyptian ($114,119, a difference of 0.24%), Paraguayan ($114,016, a difference of 0.33%), Immigrants from Spain ($113,815, a difference of 0.51%), and Immigrants from Serbia ($113,463, a difference of 0.82%). Similarly, the demographic groups most similar to Immigrants from Egypt are Immigrants from England ($112,038, a difference of 0.31%), Immigrants from North America ($112,151, a difference of 0.41%), Immigrants from Croatia ($112,323, a difference of 0.57%), Immigrants from Canada ($112,374, a difference of 0.61%), and Italian ($112,372, a difference of 0.61%).
| Demographics | Rating | Rank | Median Family Income |
| Immigrants | Pakistan | 99.8 /100 | #63 | Exceptional $114,406 |
| Immigrants | Scotland | 99.7 /100 | #64 | Exceptional $114,392 |
| Egyptians | 99.7 /100 | #65 | Exceptional $114,119 |
| Paraguayans | 99.7 /100 | #66 | Exceptional $114,016 |
| Immigrants | Spain | 99.7 /100 | #67 | Exceptional $113,815 |
| Immigrants | Serbia | 99.6 /100 | #68 | Exceptional $113,463 |
| Immigrants | Bulgaria | 99.6 /100 | #69 | Exceptional $113,461 |
| Immigrants | Romania | 99.6 /100 | #70 | Exceptional $113,434 |
| South Africans | 99.5 /100 | #71 | Exceptional $113,229 |
| Afghans | 99.5 /100 | #72 | Exceptional $112,971 |
| Laotians | 99.5 /100 | #73 | Exceptional $112,859 |
| Immigrants | Italy | 99.4 /100 | #74 | Exceptional $112,848 |
| Immigrants | Western Europe | 99.4 /100 | #75 | Exceptional $112,688 |
| Argentineans | 99.4 /100 | #76 | Exceptional $112,665 |
| Immigrants | Eastern Europe | 99.4 /100 | #77 | Exceptional $112,527 |
| Immigrants | Canada | 99.3 /100 | #78 | Exceptional $112,374 |
| Italians | 99.3 /100 | #79 | Exceptional $112,372 |
| Immigrants | Croatia | 99.3 /100 | #80 | Exceptional $112,323 |
| Immigrants | North America | 99.2 /100 | #81 | Exceptional $112,151 |
| Immigrants | England | 99.2 /100 | #82 | Exceptional $112,038 |
| Immigrants | Egypt | 99.0 /100 | #83 | Exceptional $111,689 |