Turkish vs Guatemalan Wage/Income Gap
COMPARE
Turkish
Guatemalan
Wage/Income Gap
Wage/Income Gap Comparison
Turks
Guatemalans
27.7%
WAGE/INCOME GAP
1.0/ 100
METRIC RATING
267th/ 347
METRIC RANK
22.6%
WAGE/INCOME GAP
99.9/ 100
METRIC RATING
65th/ 347
METRIC RANK
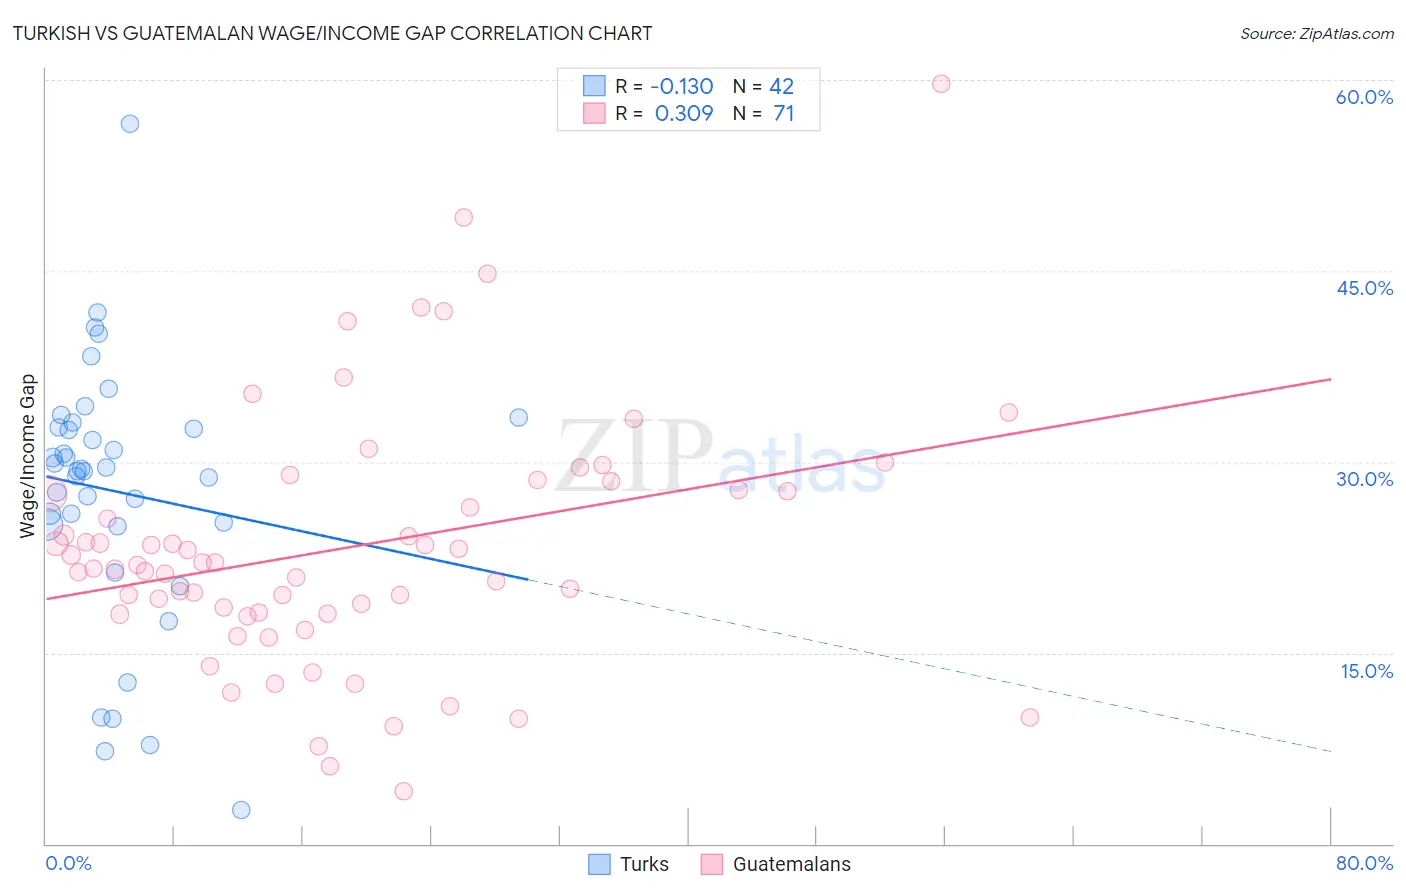
Turkish vs Guatemalan Wage/Income Gap Correlation Chart
The statistical analysis conducted on geographies consisting of 271,781,198 people shows a poor negative correlation between the proportion of Turks and wage/income gap percentage in the United States with a correlation coefficient (R) of -0.130 and weighted average of 27.7%. Similarly, the statistical analysis conducted on geographies consisting of 409,292,341 people shows a mild positive correlation between the proportion of Guatemalans and wage/income gap percentage in the United States with a correlation coefficient (R) of 0.309 and weighted average of 22.6%, a difference of 22.4%.
Wage/Income Gap Correlation Summary
| Measurement | Turkish | Guatemalan |
| Minimum | 2.6% | 4.1% |
| Maximum | 56.6% | 59.7% |
| Range | 54.0% | 55.6% |
| Mean | 27.7% | 23.3% |
| Median | 29.3% | 21.9% |
| Interquartile 25% (IQ1) | 25.1% | 18.1% |
| Interquartile 75% (IQ3) | 32.7% | 27.8% |
| Interquartile Range (IQR) | 7.6% | 9.7% |
| Standard Deviation (Sample) | 10.3% | 10.0% |
| Standard Deviation (Population) | 10.2% | 9.9% |
Similar Demographics by Wage/Income Gap
Demographics Similar to Turks by Wage/Income Gap
In terms of wage/income gap, the demographic groups most similar to Turks are Immigrants from Switzerland (27.7%, a difference of 0.020%), Serbian (27.7%, a difference of 0.020%), Hmong (27.7%, a difference of 0.020%), New Zealander (27.7%, a difference of 0.080%), and Potawatomi (27.7%, a difference of 0.090%).
| Demographics | Rating | Rank | Wage/Income Gap |
| Tongans | 1.7 /100 | #260 | Tragic 27.5% |
| Immigrants | Germany | 1.5 /100 | #261 | Tragic 27.5% |
| Immigrants | Lebanon | 1.5 /100 | #262 | Tragic 27.5% |
| Syrians | 1.4 /100 | #263 | Tragic 27.6% |
| Immigrants | Switzerland | 1.0 /100 | #264 | Tragic 27.7% |
| Serbians | 1.0 /100 | #265 | Tragic 27.7% |
| Hmong | 1.0 /100 | #266 | Tragic 27.7% |
| Turks | 1.0 /100 | #267 | Tragic 27.7% |
| New Zealanders | 1.0 /100 | #268 | Tragic 27.7% |
| Potawatomi | 0.9 /100 | #269 | Tragic 27.7% |
| Immigrants | Western Europe | 0.9 /100 | #270 | Tragic 27.8% |
| Ute | 0.8 /100 | #271 | Tragic 27.8% |
| Immigrants | Korea | 0.8 /100 | #272 | Tragic 27.8% |
| Bulgarians | 0.7 /100 | #273 | Tragic 27.8% |
| Americans | 0.7 /100 | #274 | Tragic 27.8% |
Demographics Similar to Guatemalans by Wage/Income Gap
In terms of wage/income gap, the demographic groups most similar to Guatemalans are Central American Indian (22.7%, a difference of 0.24%), Spanish American Indian (22.5%, a difference of 0.32%), Menominee (22.7%, a difference of 0.41%), Immigrants from Nigeria (22.7%, a difference of 0.42%), and Indonesian (22.7%, a difference of 0.45%).
| Demographics | Rating | Rank | Wage/Income Gap |
| Immigrants | Cuba | 100.0 /100 | #58 | Exceptional 22.4% |
| Navajo | 100.0 /100 | #59 | Exceptional 22.4% |
| Immigrants | Middle Africa | 100.0 /100 | #60 | Exceptional 22.4% |
| Immigrants | Fiji | 100.0 /100 | #61 | Exceptional 22.4% |
| Immigrants | Guatemala | 100.0 /100 | #62 | Exceptional 22.5% |
| Immigrants | Ecuador | 100.0 /100 | #63 | Exceptional 22.5% |
| Spanish American Indians | 100.0 /100 | #64 | Exceptional 22.5% |
| Guatemalans | 99.9 /100 | #65 | Exceptional 22.6% |
| Central American Indians | 99.9 /100 | #66 | Exceptional 22.7% |
| Menominee | 99.9 /100 | #67 | Exceptional 22.7% |
| Immigrants | Nigeria | 99.9 /100 | #68 | Exceptional 22.7% |
| Indonesians | 99.9 /100 | #69 | Exceptional 22.7% |
| Immigrants | Uzbekistan | 99.9 /100 | #70 | Exceptional 22.7% |
| Immigrants | El Salvador | 99.9 /100 | #71 | Exceptional 22.8% |
| Sub-Saharan Africans | 99.9 /100 | #72 | Exceptional 22.8% |