Tsimshian vs Immigrants from Poland Median Household Income
COMPARE
Tsimshian
Immigrants from Poland
Median Household Income
Median Household Income Comparison
Tsimshian
Immigrants from Poland
$83,346
MEDIAN HOUSEHOLD INCOME
24.5/ 100
METRIC RATING
200th/ 347
METRIC RANK
$90,549
MEDIAN HOUSEHOLD INCOME
97.1/ 100
METRIC RATING
111th/ 347
METRIC RANK
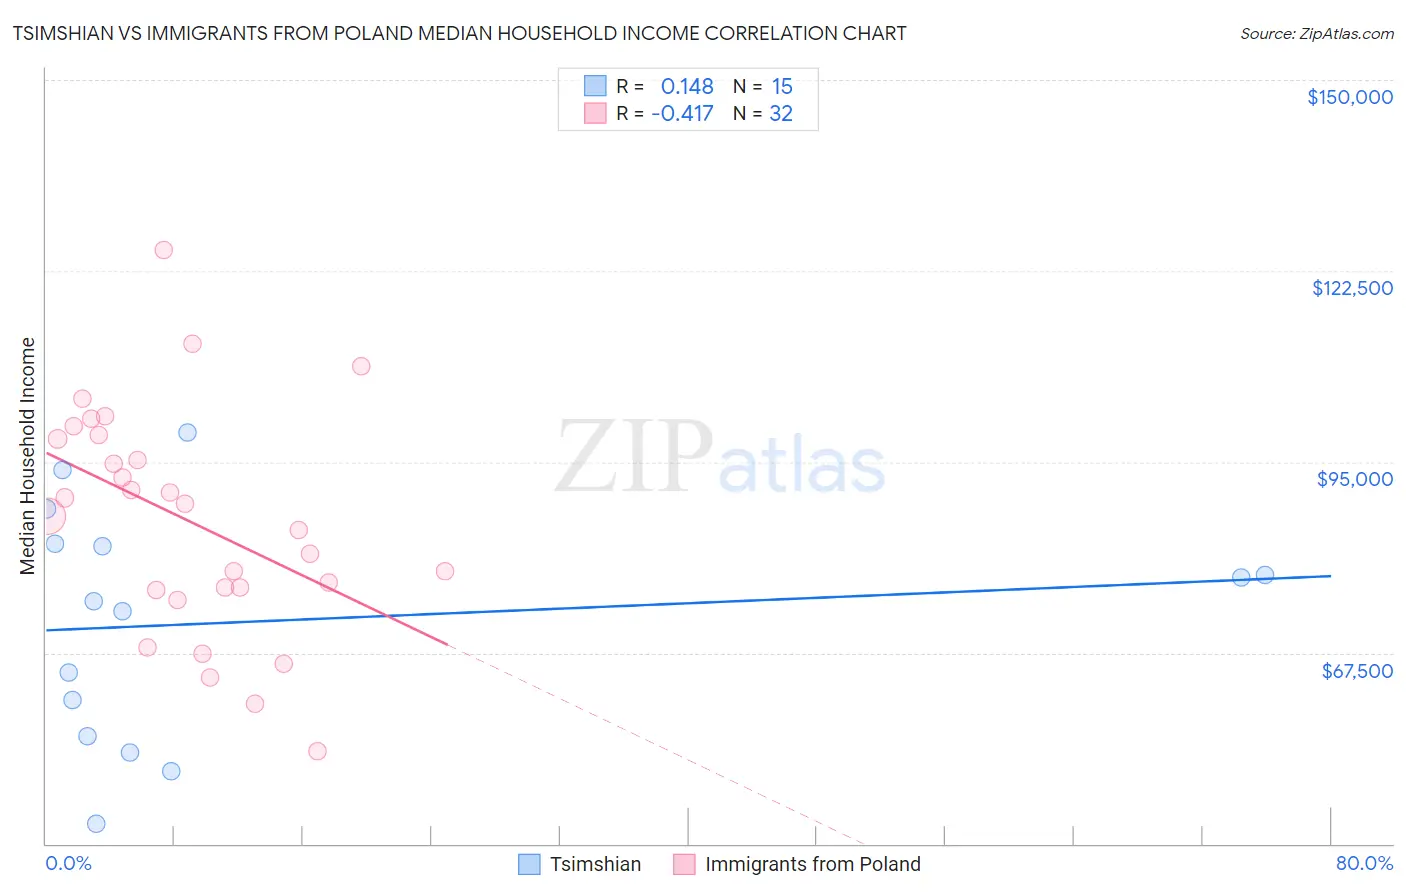
Tsimshian vs Immigrants from Poland Median Household Income Correlation Chart
The statistical analysis conducted on geographies consisting of 15,626,462 people shows a poor positive correlation between the proportion of Tsimshian and median household income in the United States with a correlation coefficient (R) of 0.148 and weighted average of $83,346. Similarly, the statistical analysis conducted on geographies consisting of 304,762,880 people shows a moderate negative correlation between the proportion of Immigrants from Poland and median household income in the United States with a correlation coefficient (R) of -0.417 and weighted average of $90,549, a difference of 8.6%.
Median Household Income Correlation Summary
| Measurement | Tsimshian | Immigrants from Poland |
| Minimum | $42,857 | $53,329 |
| Maximum | $99,167 | $125,589 |
| Range | $56,310 | $72,260 |
| Mean | $71,994 | $86,504 |
| Median | $75,000 | $88,122 |
| Interquartile 25% (IQ1) | $55,448 | $76,692 |
| Interquartile 75% (IQ3) | $83,217 | $98,535 |
| Interquartile Range (IQR) | $27,769 | $21,843 |
| Standard Deviation (Sample) | $16,777 | $16,261 |
| Standard Deviation (Population) | $16,208 | $16,005 |
Similar Demographics by Median Household Income
Demographics Similar to Tsimshian by Median Household Income
In terms of median household income, the demographic groups most similar to Tsimshian are Spanish ($83,343, a difference of 0.0%), German ($83,358, a difference of 0.010%), Immigrants from Thailand ($83,327, a difference of 0.020%), Immigrants from Cambodia ($83,304, a difference of 0.050%), and Japanese ($83,395, a difference of 0.060%).
| Demographics | Rating | Rank | Median Household Income |
| Finns | 27.7 /100 | #193 | Fair $83,607 |
| Ghanaians | 27.4 /100 | #194 | Fair $83,582 |
| Immigrants | Armenia | 27.0 /100 | #195 | Fair $83,555 |
| French | 26.0 /100 | #196 | Fair $83,468 |
| Aleuts | 25.7 /100 | #197 | Fair $83,446 |
| Japanese | 25.1 /100 | #198 | Fair $83,395 |
| Germans | 24.6 /100 | #199 | Fair $83,358 |
| Tsimshian | 24.5 /100 | #200 | Fair $83,346 |
| Spanish | 24.4 /100 | #201 | Fair $83,343 |
| Immigrants | Thailand | 24.3 /100 | #202 | Fair $83,327 |
| Immigrants | Cambodia | 24.0 /100 | #203 | Fair $83,304 |
| Immigrants | Africa | 23.8 /100 | #204 | Fair $83,289 |
| Celtics | 22.7 /100 | #205 | Fair $83,193 |
| Immigrants | Kenya | 21.3 /100 | #206 | Fair $83,068 |
| Dutch | 20.3 /100 | #207 | Fair $82,971 |
Demographics Similar to Immigrants from Poland by Median Household Income
In terms of median household income, the demographic groups most similar to Immigrants from Poland are Palestinian ($90,574, a difference of 0.030%), Chilean ($90,605, a difference of 0.060%), Zimbabwean ($90,618, a difference of 0.080%), Northern European ($90,446, a difference of 0.11%), and Croatian ($90,685, a difference of 0.15%).
| Demographics | Rating | Rank | Median Household Income |
| Immigrants | Kazakhstan | 97.8 /100 | #104 | Exceptional $91,015 |
| Immigrants | Brazil | 97.7 /100 | #105 | Exceptional $90,907 |
| Macedonians | 97.4 /100 | #106 | Exceptional $90,761 |
| Croatians | 97.3 /100 | #107 | Exceptional $90,685 |
| Zimbabweans | 97.2 /100 | #108 | Exceptional $90,618 |
| Chileans | 97.2 /100 | #109 | Exceptional $90,605 |
| Palestinians | 97.1 /100 | #110 | Exceptional $90,574 |
| Immigrants | Poland | 97.1 /100 | #111 | Exceptional $90,549 |
| Northern Europeans | 96.9 /100 | #112 | Exceptional $90,446 |
| Peruvians | 96.5 /100 | #113 | Exceptional $90,261 |
| Immigrants | Northern Africa | 95.9 /100 | #114 | Exceptional $90,026 |
| Immigrants | Western Asia | 95.9 /100 | #115 | Exceptional $90,005 |
| Native Hawaiians | 95.7 /100 | #116 | Exceptional $89,919 |
| Taiwanese | 95.6 /100 | #117 | Exceptional $89,900 |
| Syrians | 95.4 /100 | #118 | Exceptional $89,830 |