Tsimshian vs Indonesian Median Household Income
COMPARE
Tsimshian
Indonesian
Median Household Income
Median Household Income Comparison
Tsimshian
Indonesians
$83,346
MEDIAN HOUSEHOLD INCOME
24.5/ 100
METRIC RATING
200th/ 347
METRIC RANK
$72,856
MEDIAN HOUSEHOLD INCOME
0.0/ 100
METRIC RATING
299th/ 347
METRIC RANK
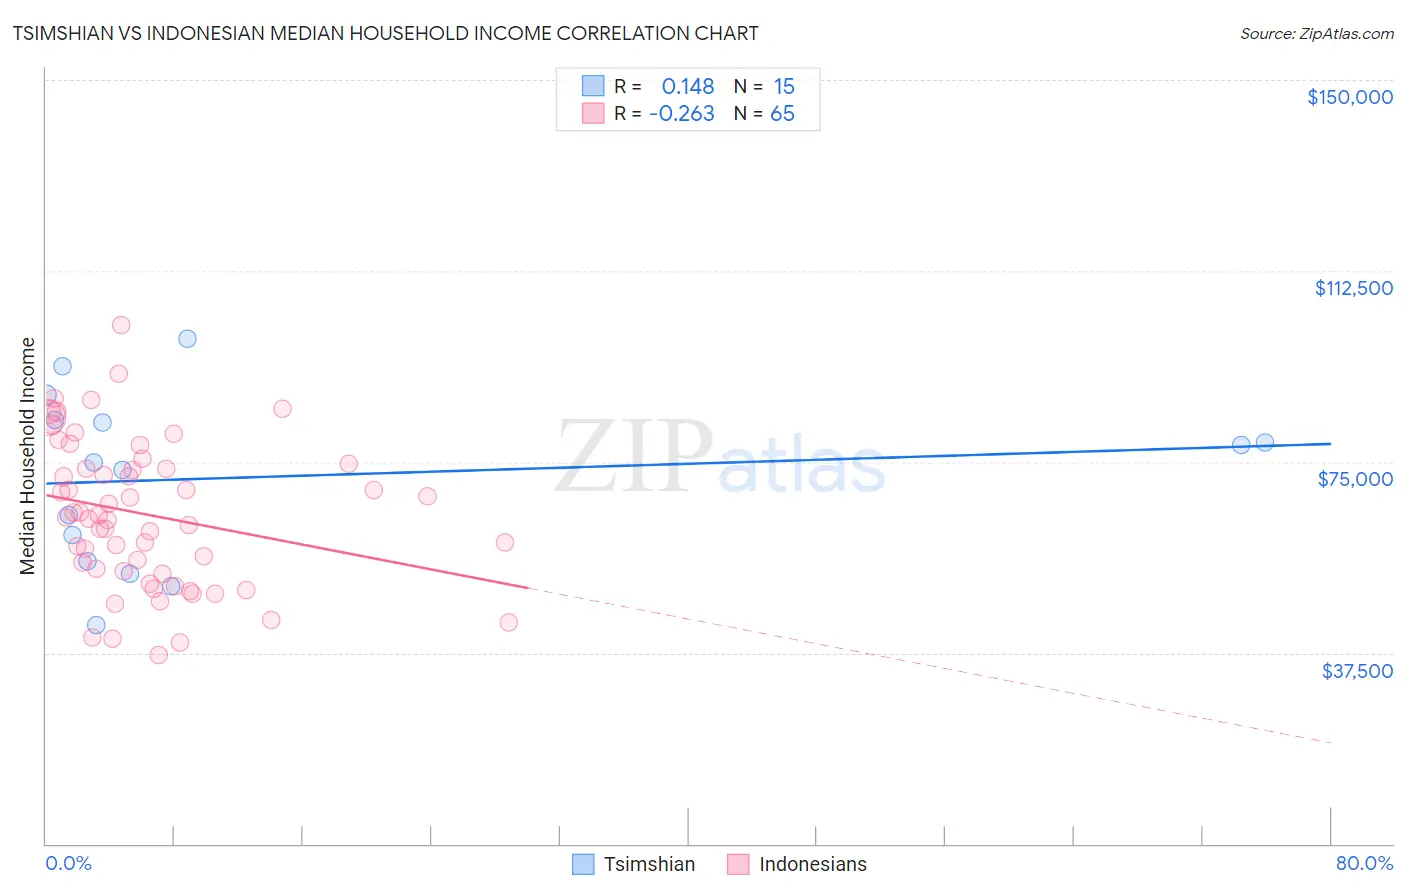
Tsimshian vs Indonesian Median Household Income Correlation Chart
The statistical analysis conducted on geographies consisting of 15,626,462 people shows a poor positive correlation between the proportion of Tsimshian and median household income in the United States with a correlation coefficient (R) of 0.148 and weighted average of $83,346. Similarly, the statistical analysis conducted on geographies consisting of 162,609,195 people shows a weak negative correlation between the proportion of Indonesians and median household income in the United States with a correlation coefficient (R) of -0.263 and weighted average of $72,856, a difference of 14.4%.
Median Household Income Correlation Summary
| Measurement | Tsimshian | Indonesian |
| Minimum | $42,857 | $36,966 |
| Maximum | $99,167 | $101,767 |
| Range | $56,310 | $64,801 |
| Mean | $71,994 | $64,599 |
| Median | $75,000 | $64,081 |
| Interquartile 25% (IQ1) | $55,448 | $53,194 |
| Interquartile 75% (IQ3) | $83,217 | $74,214 |
| Interquartile Range (IQR) | $27,769 | $21,021 |
| Standard Deviation (Sample) | $16,777 | $14,432 |
| Standard Deviation (Population) | $16,208 | $14,321 |
Similar Demographics by Median Household Income
Demographics Similar to Tsimshian by Median Household Income
In terms of median household income, the demographic groups most similar to Tsimshian are Spanish ($83,343, a difference of 0.0%), German ($83,358, a difference of 0.010%), Immigrants from Thailand ($83,327, a difference of 0.020%), Immigrants from Cambodia ($83,304, a difference of 0.050%), and Japanese ($83,395, a difference of 0.060%).
| Demographics | Rating | Rank | Median Household Income |
| Finns | 27.7 /100 | #193 | Fair $83,607 |
| Ghanaians | 27.4 /100 | #194 | Fair $83,582 |
| Immigrants | Armenia | 27.0 /100 | #195 | Fair $83,555 |
| French | 26.0 /100 | #196 | Fair $83,468 |
| Aleuts | 25.7 /100 | #197 | Fair $83,446 |
| Japanese | 25.1 /100 | #198 | Fair $83,395 |
| Germans | 24.6 /100 | #199 | Fair $83,358 |
| Tsimshian | 24.5 /100 | #200 | Fair $83,346 |
| Spanish | 24.4 /100 | #201 | Fair $83,343 |
| Immigrants | Thailand | 24.3 /100 | #202 | Fair $83,327 |
| Immigrants | Cambodia | 24.0 /100 | #203 | Fair $83,304 |
| Immigrants | Africa | 23.8 /100 | #204 | Fair $83,289 |
| Celtics | 22.7 /100 | #205 | Fair $83,193 |
| Immigrants | Kenya | 21.3 /100 | #206 | Fair $83,068 |
| Dutch | 20.3 /100 | #207 | Fair $82,971 |
Demographics Similar to Indonesians by Median Household Income
In terms of median household income, the demographic groups most similar to Indonesians are Immigrants from Dominica ($72,760, a difference of 0.13%), Paiute ($72,959, a difference of 0.14%), Cherokee ($72,682, a difference of 0.24%), Shoshone ($72,660, a difference of 0.27%), and African ($72,650, a difference of 0.28%).
| Demographics | Rating | Rank | Median Household Income |
| Comanche | 0.1 /100 | #292 | Tragic $73,747 |
| Immigrants | Cabo Verde | 0.1 /100 | #293 | Tragic $73,515 |
| Blackfeet | 0.1 /100 | #294 | Tragic $73,509 |
| Cubans | 0.1 /100 | #295 | Tragic $73,392 |
| Haitians | 0.1 /100 | #296 | Tragic $73,306 |
| Immigrants | Mexico | 0.0 /100 | #297 | Tragic $73,160 |
| Paiute | 0.0 /100 | #298 | Tragic $72,959 |
| Indonesians | 0.0 /100 | #299 | Tragic $72,856 |
| Immigrants | Dominica | 0.0 /100 | #300 | Tragic $72,760 |
| Cherokee | 0.0 /100 | #301 | Tragic $72,682 |
| Shoshone | 0.0 /100 | #302 | Tragic $72,660 |
| Africans | 0.0 /100 | #303 | Tragic $72,650 |
| Immigrants | Haiti | 0.0 /100 | #304 | Tragic $72,599 |
| Hondurans | 0.0 /100 | #305 | Tragic $72,588 |
| Potawatomi | 0.0 /100 | #306 | Tragic $72,576 |