Iraqi vs Immigrants from Poland Median Household Income
COMPARE
Iraqi
Immigrants from Poland
Median Household Income
Median Household Income Comparison
Iraqis
Immigrants from Poland
$83,753
MEDIAN HOUSEHOLD INCOME
29.6/ 100
METRIC RATING
191st/ 347
METRIC RANK
$90,549
MEDIAN HOUSEHOLD INCOME
97.1/ 100
METRIC RATING
111th/ 347
METRIC RANK
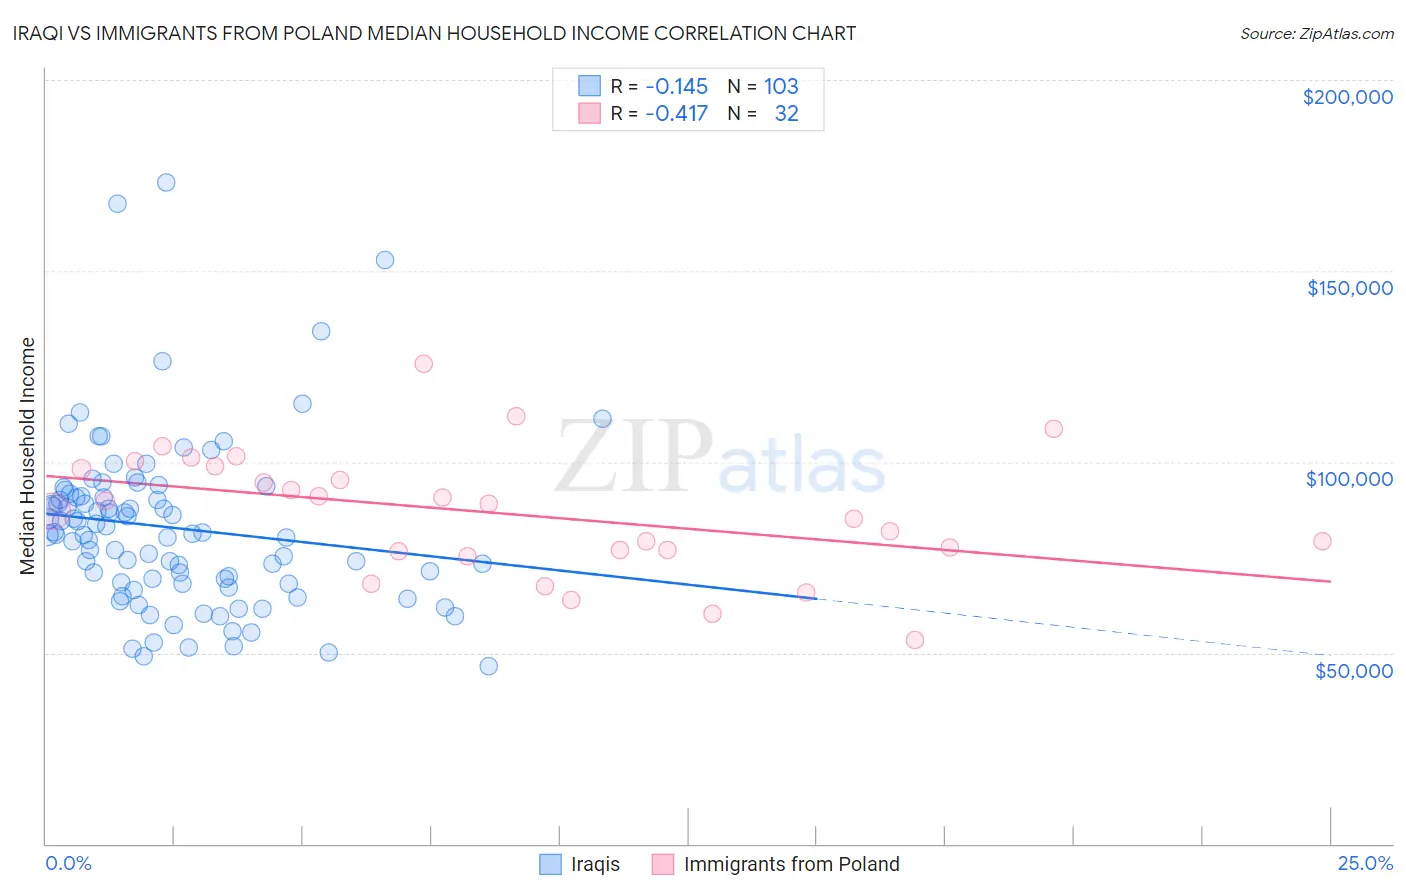
Iraqi vs Immigrants from Poland Median Household Income Correlation Chart
The statistical analysis conducted on geographies consisting of 170,587,047 people shows a poor negative correlation between the proportion of Iraqis and median household income in the United States with a correlation coefficient (R) of -0.145 and weighted average of $83,753. Similarly, the statistical analysis conducted on geographies consisting of 304,762,880 people shows a moderate negative correlation between the proportion of Immigrants from Poland and median household income in the United States with a correlation coefficient (R) of -0.417 and weighted average of $90,549, a difference of 8.1%.
Median Household Income Correlation Summary
| Measurement | Iraqi | Immigrants from Poland |
| Minimum | $46,565 | $53,329 |
| Maximum | $173,015 | $125,589 |
| Range | $126,450 | $72,260 |
| Mean | $82,738 | $86,504 |
| Median | $81,250 | $88,122 |
| Interquartile 25% (IQ1) | $68,093 | $76,692 |
| Interquartile 75% (IQ3) | $91,098 | $98,535 |
| Interquartile Range (IQR) | $23,005 | $21,843 |
| Standard Deviation (Sample) | $22,309 | $16,261 |
| Standard Deviation (Population) | $22,201 | $16,005 |
Similar Demographics by Median Household Income
Demographics Similar to Iraqis by Median Household Income
In terms of median household income, the demographic groups most similar to Iraqis are Slovak ($83,798, a difference of 0.050%), Welsh ($83,628, a difference of 0.15%), Immigrants from Colombia ($83,902, a difference of 0.18%), Finnish ($83,607, a difference of 0.18%), and Ghanaian ($83,582, a difference of 0.21%).
| Demographics | Rating | Rank | Median Household Income |
| Immigrants | Eastern Africa | 37.4 /100 | #184 | Fair $84,299 |
| Kenyans | 34.2 /100 | #185 | Fair $84,085 |
| Puget Sound Salish | 33.2 /100 | #186 | Fair $84,011 |
| Belgians | 33.2 /100 | #187 | Fair $84,008 |
| Tlingit-Haida | 32.6 /100 | #188 | Fair $83,968 |
| Immigrants | Colombia | 31.7 /100 | #189 | Fair $83,902 |
| Slovaks | 30.2 /100 | #190 | Fair $83,798 |
| Iraqis | 29.6 /100 | #191 | Fair $83,753 |
| Welsh | 28.0 /100 | #192 | Fair $83,628 |
| Finns | 27.7 /100 | #193 | Fair $83,607 |
| Ghanaians | 27.4 /100 | #194 | Fair $83,582 |
| Immigrants | Armenia | 27.0 /100 | #195 | Fair $83,555 |
| French | 26.0 /100 | #196 | Fair $83,468 |
| Aleuts | 25.7 /100 | #197 | Fair $83,446 |
| Japanese | 25.1 /100 | #198 | Fair $83,395 |
Demographics Similar to Immigrants from Poland by Median Household Income
In terms of median household income, the demographic groups most similar to Immigrants from Poland are Palestinian ($90,574, a difference of 0.030%), Chilean ($90,605, a difference of 0.060%), Zimbabwean ($90,618, a difference of 0.080%), Northern European ($90,446, a difference of 0.11%), and Croatian ($90,685, a difference of 0.15%).
| Demographics | Rating | Rank | Median Household Income |
| Immigrants | Kazakhstan | 97.8 /100 | #104 | Exceptional $91,015 |
| Immigrants | Brazil | 97.7 /100 | #105 | Exceptional $90,907 |
| Macedonians | 97.4 /100 | #106 | Exceptional $90,761 |
| Croatians | 97.3 /100 | #107 | Exceptional $90,685 |
| Zimbabweans | 97.2 /100 | #108 | Exceptional $90,618 |
| Chileans | 97.2 /100 | #109 | Exceptional $90,605 |
| Palestinians | 97.1 /100 | #110 | Exceptional $90,574 |
| Immigrants | Poland | 97.1 /100 | #111 | Exceptional $90,549 |
| Northern Europeans | 96.9 /100 | #112 | Exceptional $90,446 |
| Peruvians | 96.5 /100 | #113 | Exceptional $90,261 |
| Immigrants | Northern Africa | 95.9 /100 | #114 | Exceptional $90,026 |
| Immigrants | Western Asia | 95.9 /100 | #115 | Exceptional $90,005 |
| Native Hawaiians | 95.7 /100 | #116 | Exceptional $89,919 |
| Taiwanese | 95.6 /100 | #117 | Exceptional $89,900 |
| Syrians | 95.4 /100 | #118 | Exceptional $89,830 |