Tsimshian vs Immigrants from Western Europe Median Male Earnings
COMPARE
Tsimshian
Immigrants from Western Europe
Median Male Earnings
Median Male Earnings Comparison
Tsimshian
Immigrants from Western Europe
$48,836
MEDIAN MALE EARNINGS
0.4/ 100
METRIC RATING
269th/ 347
METRIC RANK
$60,334
MEDIAN MALE EARNINGS
99.7/ 100
METRIC RATING
72nd/ 347
METRIC RANK
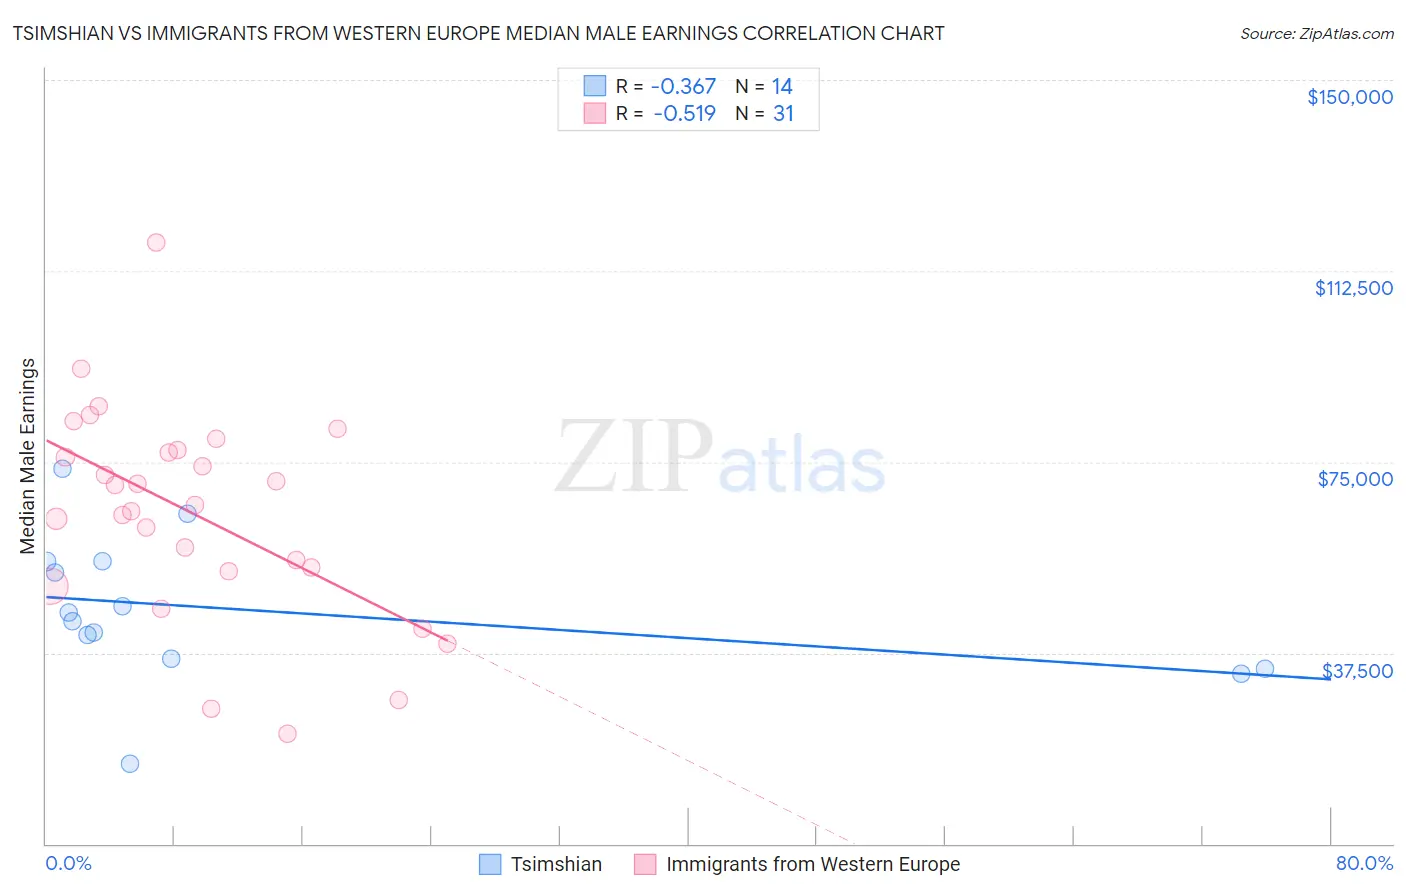
Tsimshian vs Immigrants from Western Europe Median Male Earnings Correlation Chart
The statistical analysis conducted on geographies consisting of 15,625,423 people shows a mild negative correlation between the proportion of Tsimshian and median male earnings in the United States with a correlation coefficient (R) of -0.367 and weighted average of $48,836. Similarly, the statistical analysis conducted on geographies consisting of 493,675,126 people shows a substantial negative correlation between the proportion of Immigrants from Western Europe and median male earnings in the United States with a correlation coefficient (R) of -0.519 and weighted average of $60,334, a difference of 23.5%.
Median Male Earnings Correlation Summary
| Measurement | Tsimshian | Immigrants from Western Europe |
| Minimum | $15,625 | $21,715 |
| Maximum | $73,588 | $118,110 |
| Range | $57,963 | $96,395 |
| Mean | $45,710 | $64,948 |
| Median | $44,489 | $66,494 |
| Interquartile 25% (IQ1) | $36,250 | $53,531 |
| Interquartile 75% (IQ3) | $55,386 | $77,220 |
| Interquartile Range (IQR) | $19,136 | $23,689 |
| Standard Deviation (Sample) | $14,437 | $20,607 |
| Standard Deviation (Population) | $13,911 | $20,272 |
Similar Demographics by Median Male Earnings
Demographics Similar to Tsimshian by Median Male Earnings
In terms of median male earnings, the demographic groups most similar to Tsimshian are Ute ($48,899, a difference of 0.13%), Potawatomi ($48,768, a difference of 0.14%), Cherokee ($48,669, a difference of 0.34%), Spanish American ($49,008, a difference of 0.35%), and Somali ($49,025, a difference of 0.39%).
| Demographics | Rating | Rank | Median Male Earnings |
| Immigrants | West Indies | 0.6 /100 | #262 | Tragic $49,271 |
| Nicaraguans | 0.6 /100 | #263 | Tragic $49,215 |
| Immigrants | Middle Africa | 0.6 /100 | #264 | Tragic $49,201 |
| Immigrants | Laos | 0.6 /100 | #265 | Tragic $49,190 |
| Somalis | 0.5 /100 | #266 | Tragic $49,025 |
| Spanish Americans | 0.5 /100 | #267 | Tragic $49,008 |
| Ute | 0.4 /100 | #268 | Tragic $48,899 |
| Tsimshian | 0.4 /100 | #269 | Tragic $48,836 |
| Potawatomi | 0.4 /100 | #270 | Tragic $48,768 |
| Cherokee | 0.3 /100 | #271 | Tragic $48,669 |
| Salvadorans | 0.3 /100 | #272 | Tragic $48,646 |
| Jamaicans | 0.3 /100 | #273 | Tragic $48,632 |
| Colville | 0.3 /100 | #274 | Tragic $48,516 |
| Immigrants | Somalia | 0.3 /100 | #275 | Tragic $48,439 |
| Blackfeet | 0.3 /100 | #276 | Tragic $48,402 |
Demographics Similar to Immigrants from Western Europe by Median Male Earnings
In terms of median male earnings, the demographic groups most similar to Immigrants from Western Europe are Mongolian ($60,350, a difference of 0.030%), Immigrants from Bulgaria ($60,358, a difference of 0.040%), Immigrants from Canada ($60,388, a difference of 0.090%), Immigrants from North America ($60,265, a difference of 0.12%), and Argentinean ($60,117, a difference of 0.36%).
| Demographics | Rating | Rank | Median Male Earnings |
| Immigrants | Indonesia | 99.8 /100 | #65 | Exceptional $60,935 |
| Immigrants | Croatia | 99.8 /100 | #66 | Exceptional $60,914 |
| Immigrants | Spain | 99.8 /100 | #67 | Exceptional $60,750 |
| Immigrants | Serbia | 99.7 /100 | #68 | Exceptional $60,600 |
| Immigrants | Canada | 99.7 /100 | #69 | Exceptional $60,388 |
| Immigrants | Bulgaria | 99.7 /100 | #70 | Exceptional $60,358 |
| Mongolians | 99.7 /100 | #71 | Exceptional $60,350 |
| Immigrants | Western Europe | 99.7 /100 | #72 | Exceptional $60,334 |
| Immigrants | North America | 99.7 /100 | #73 | Exceptional $60,265 |
| Argentineans | 99.6 /100 | #74 | Exceptional $60,117 |
| Immigrants | Bolivia | 99.6 /100 | #75 | Exceptional $60,088 |
| Romanians | 99.6 /100 | #76 | Exceptional $60,063 |
| Paraguayans | 99.5 /100 | #77 | Exceptional $59,975 |
| Immigrants | Egypt | 99.5 /100 | #78 | Exceptional $59,925 |
| Immigrants | Ukraine | 99.5 /100 | #79 | Exceptional $59,820 |