Trinidadian and Tobagonian vs Immigrants from England Wage/Income Gap
COMPARE
Trinidadian and Tobagonian
Immigrants from England
Wage/Income Gap
Wage/Income Gap Comparison
Trinidadians and Tobagonians
Immigrants from England
19.3%
WAGE/INCOME GAP
100.0/ 100
METRIC RATING
13th/ 347
METRIC RANK
27.9%
WAGE/INCOME GAP
0.6/ 100
METRIC RATING
278th/ 347
METRIC RANK
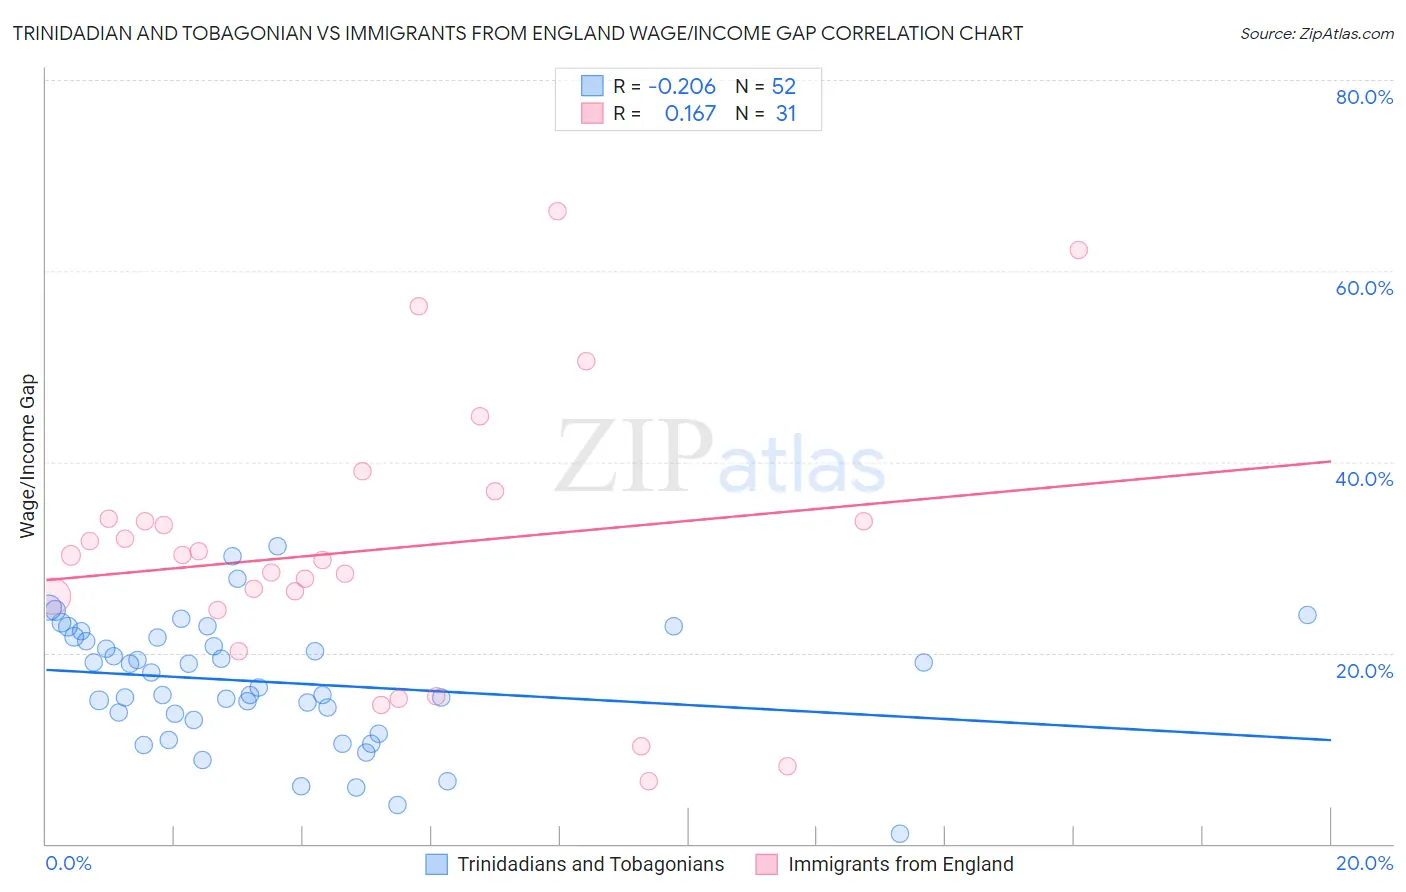
Trinidadian and Tobagonian vs Immigrants from England Wage/Income Gap Correlation Chart
The statistical analysis conducted on geographies consisting of 219,803,176 people shows a weak negative correlation between the proportion of Trinidadians and Tobagonians and wage/income gap percentage in the United States with a correlation coefficient (R) of -0.206 and weighted average of 19.3%. Similarly, the statistical analysis conducted on geographies consisting of 391,474,935 people shows a poor positive correlation between the proportion of Immigrants from England and wage/income gap percentage in the United States with a correlation coefficient (R) of 0.167 and weighted average of 27.9%, a difference of 44.3%.
Wage/Income Gap Correlation Summary
| Measurement | Trinidadian and Tobagonian | Immigrants from England |
| Minimum | 1.0% | 6.6% |
| Maximum | 31.1% | 66.3% |
| Range | 30.1% | 59.7% |
| Mean | 16.9% | 30.8% |
| Median | 17.1% | 30.2% |
| Interquartile 25% (IQ1) | 13.3% | 24.5% |
| Interquartile 75% (IQ3) | 21.6% | 34.1% |
| Interquartile Range (IQR) | 8.3% | 9.6% |
| Standard Deviation (Sample) | 6.5% | 14.3% |
| Standard Deviation (Population) | 6.4% | 14.0% |
Similar Demographics by Wage/Income Gap
Demographics Similar to Trinidadians and Tobagonians by Wage/Income Gap
In terms of wage/income gap, the demographic groups most similar to Trinidadians and Tobagonians are Immigrants from Trinidad and Tobago (19.3%, a difference of 0.050%), Immigrants from West Indies (19.2%, a difference of 0.48%), Immigrants from Haiti (19.2%, a difference of 0.59%), West Indian (19.6%, a difference of 1.2%), and Jamaican (19.6%, a difference of 1.4%).
| Demographics | Rating | Rank | Wage/Income Gap |
| Immigrants | Guyana | 100.0 /100 | #6 | Exceptional 18.4% |
| Puerto Ricans | 100.0 /100 | #7 | Exceptional 18.7% |
| Immigrants | Jamaica | 100.0 /100 | #8 | Exceptional 18.8% |
| Barbadians | 100.0 /100 | #9 | Exceptional 19.0% |
| Crow | 100.0 /100 | #10 | Exceptional 19.1% |
| Immigrants | Haiti | 100.0 /100 | #11 | Exceptional 19.2% |
| Immigrants | West Indies | 100.0 /100 | #12 | Exceptional 19.2% |
| Trinidadians and Tobagonians | 100.0 /100 | #13 | Exceptional 19.3% |
| Immigrants | Trinidad and Tobago | 100.0 /100 | #14 | Exceptional 19.3% |
| West Indians | 100.0 /100 | #15 | Exceptional 19.6% |
| Jamaicans | 100.0 /100 | #16 | Exceptional 19.6% |
| Haitians | 100.0 /100 | #17 | Exceptional 19.7% |
| Hopi | 100.0 /100 | #18 | Exceptional 20.0% |
| Immigrants | Dominica | 100.0 /100 | #19 | Exceptional 20.0% |
| Bahamians | 100.0 /100 | #20 | Exceptional 20.2% |
Demographics Similar to Immigrants from England by Wage/Income Gap
In terms of wage/income gap, the demographic groups most similar to Immigrants from England are Lebanese (27.9%, a difference of 0.080%), Latvian (27.9%, a difference of 0.080%), Immigrants from Japan (27.9%, a difference of 0.11%), American (27.8%, a difference of 0.19%), and Bulgarian (27.8%, a difference of 0.23%).
| Demographics | Rating | Rank | Wage/Income Gap |
| Ute | 0.8 /100 | #271 | Tragic 27.8% |
| Immigrants | Korea | 0.8 /100 | #272 | Tragic 27.8% |
| Bulgarians | 0.7 /100 | #273 | Tragic 27.8% |
| Americans | 0.7 /100 | #274 | Tragic 27.8% |
| Immigrants | Japan | 0.7 /100 | #275 | Tragic 27.9% |
| Lebanese | 0.7 /100 | #276 | Tragic 27.9% |
| Latvians | 0.7 /100 | #277 | Tragic 27.9% |
| Immigrants | England | 0.6 /100 | #278 | Tragic 27.9% |
| Romanians | 0.5 /100 | #279 | Tragic 28.0% |
| Russians | 0.5 /100 | #280 | Tragic 28.0% |
| Burmese | 0.5 /100 | #281 | Tragic 28.0% |
| South Africans | 0.5 /100 | #282 | Tragic 28.0% |
| French Canadians | 0.4 /100 | #283 | Tragic 28.1% |
| Immigrants | Sweden | 0.4 /100 | #284 | Tragic 28.1% |
| Italians | 0.4 /100 | #285 | Tragic 28.1% |