Argentinean vs Immigrants from England Wage/Income Gap
COMPARE
Argentinean
Immigrants from England
Wage/Income Gap
Wage/Income Gap Comparison
Argentineans
Immigrants from England
27.0%
WAGE/INCOME GAP
5.2/ 100
METRIC RATING
232nd/ 347
METRIC RANK
27.9%
WAGE/INCOME GAP
0.6/ 100
METRIC RATING
278th/ 347
METRIC RANK
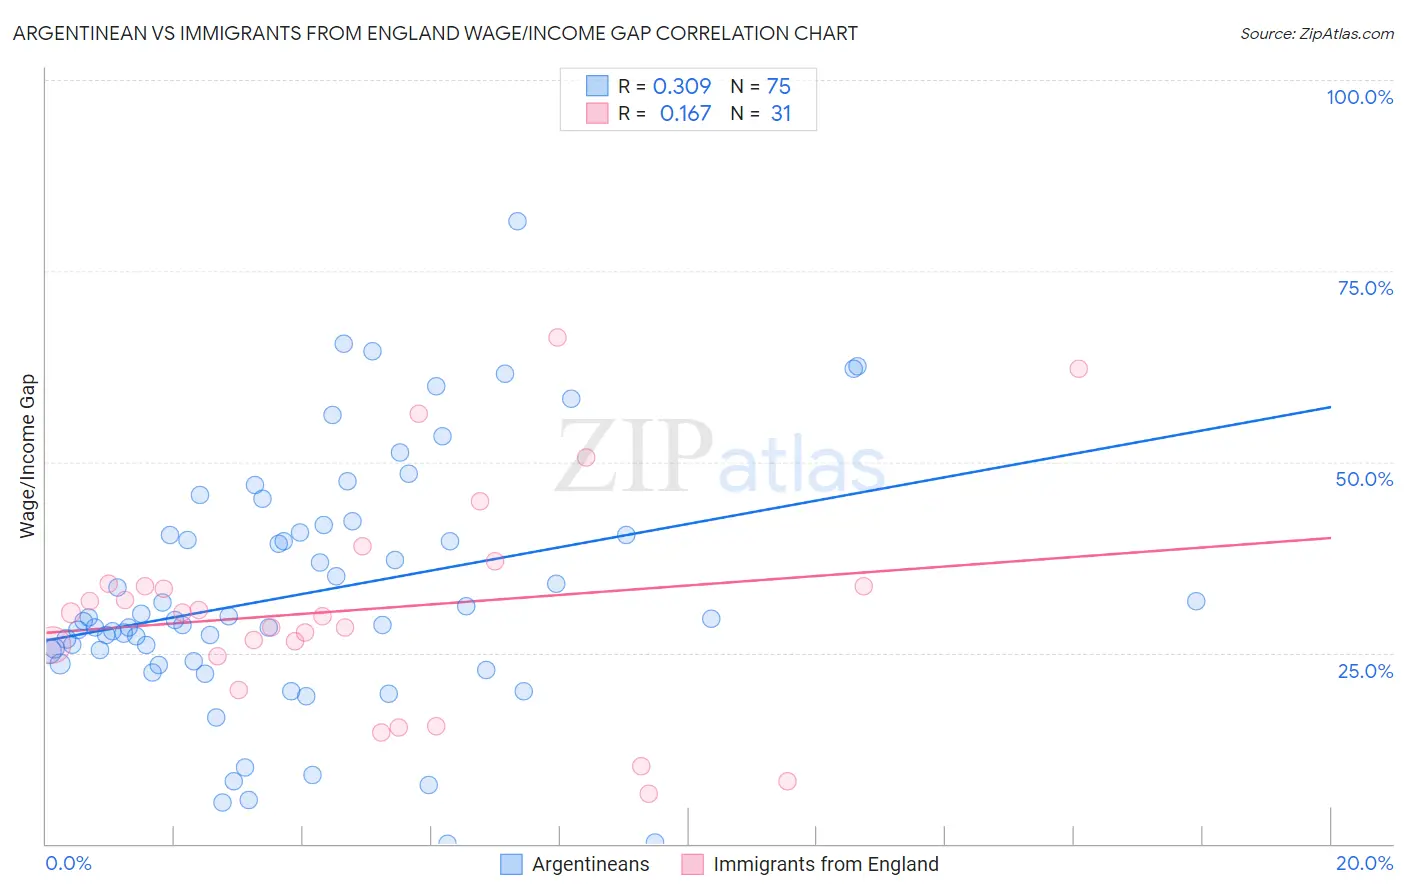
Argentinean vs Immigrants from England Wage/Income Gap Correlation Chart
The statistical analysis conducted on geographies consisting of 297,053,015 people shows a mild positive correlation between the proportion of Argentineans and wage/income gap percentage in the United States with a correlation coefficient (R) of 0.309 and weighted average of 27.0%. Similarly, the statistical analysis conducted on geographies consisting of 391,474,935 people shows a poor positive correlation between the proportion of Immigrants from England and wage/income gap percentage in the United States with a correlation coefficient (R) of 0.167 and weighted average of 27.9%, a difference of 3.3%.
Wage/Income Gap Correlation Summary
| Measurement | Argentinean | Immigrants from England |
| Minimum | 0.074% | 6.6% |
| Maximum | 81.5% | 66.3% |
| Range | 81.4% | 59.7% |
| Mean | 32.9% | 30.8% |
| Median | 29.2% | 30.2% |
| Interquartile 25% (IQ1) | 24.0% | 24.5% |
| Interquartile 75% (IQ3) | 40.7% | 34.1% |
| Interquartile Range (IQR) | 16.8% | 9.6% |
| Standard Deviation (Sample) | 16.2% | 14.3% |
| Standard Deviation (Population) | 16.1% | 14.0% |
Similar Demographics by Wage/Income Gap
Demographics Similar to Argentineans by Wage/Income Gap
In terms of wage/income gap, the demographic groups most similar to Argentineans are Bhutanese (27.0%, a difference of 0.020%), Ottawa (27.0%, a difference of 0.050%), Immigrants from Brazil (27.0%, a difference of 0.060%), Immigrants from Asia (27.0%, a difference of 0.10%), and Immigrants from Pakistan (27.0%, a difference of 0.11%).
| Demographics | Rating | Rank | Wage/Income Gap |
| Immigrants | Ireland | 6.5 /100 | #225 | Tragic 26.9% |
| Asians | 5.9 /100 | #226 | Tragic 26.9% |
| Spaniards | 5.6 /100 | #227 | Tragic 27.0% |
| Immigrants | Turkey | 5.6 /100 | #228 | Tragic 27.0% |
| Immigrants | Asia | 5.5 /100 | #229 | Tragic 27.0% |
| Ottawa | 5.3 /100 | #230 | Tragic 27.0% |
| Bhutanese | 5.3 /100 | #231 | Tragic 27.0% |
| Argentineans | 5.2 /100 | #232 | Tragic 27.0% |
| Immigrants | Brazil | 5.0 /100 | #233 | Tragic 27.0% |
| Immigrants | Pakistan | 4.9 /100 | #234 | Tragic 27.0% |
| Immigrants | Hungary | 4.8 /100 | #235 | Tragic 27.0% |
| Immigrants | Romania | 4.8 /100 | #236 | Tragic 27.0% |
| Immigrants | Eastern Asia | 4.4 /100 | #237 | Tragic 27.1% |
| Osage | 4.4 /100 | #238 | Tragic 27.1% |
| Estonians | 4.3 /100 | #239 | Tragic 27.1% |
Demographics Similar to Immigrants from England by Wage/Income Gap
In terms of wage/income gap, the demographic groups most similar to Immigrants from England are Lebanese (27.9%, a difference of 0.080%), Latvian (27.9%, a difference of 0.080%), Immigrants from Japan (27.9%, a difference of 0.11%), American (27.8%, a difference of 0.19%), and Bulgarian (27.8%, a difference of 0.23%).
| Demographics | Rating | Rank | Wage/Income Gap |
| Ute | 0.8 /100 | #271 | Tragic 27.8% |
| Immigrants | Korea | 0.8 /100 | #272 | Tragic 27.8% |
| Bulgarians | 0.7 /100 | #273 | Tragic 27.8% |
| Americans | 0.7 /100 | #274 | Tragic 27.8% |
| Immigrants | Japan | 0.7 /100 | #275 | Tragic 27.9% |
| Lebanese | 0.7 /100 | #276 | Tragic 27.9% |
| Latvians | 0.7 /100 | #277 | Tragic 27.9% |
| Immigrants | England | 0.6 /100 | #278 | Tragic 27.9% |
| Romanians | 0.5 /100 | #279 | Tragic 28.0% |
| Russians | 0.5 /100 | #280 | Tragic 28.0% |
| Burmese | 0.5 /100 | #281 | Tragic 28.0% |
| South Africans | 0.5 /100 | #282 | Tragic 28.0% |
| French Canadians | 0.4 /100 | #283 | Tragic 28.1% |
| Immigrants | Sweden | 0.4 /100 | #284 | Tragic 28.1% |
| Italians | 0.4 /100 | #285 | Tragic 28.1% |