Tohono O'odham vs Immigrants from Nepal Wage/Income Gap
COMPARE
Tohono O'odham
Immigrants from Nepal
Wage/Income Gap
Wage/Income Gap Comparison
Tohono O'odham
Immigrants from Nepal
22.1%
WAGE/INCOME GAP
100.0/ 100
METRIC RATING
51st/ 347
METRIC RANK
24.9%
WAGE/INCOME GAP
89.3/ 100
METRIC RATING
140th/ 347
METRIC RANK
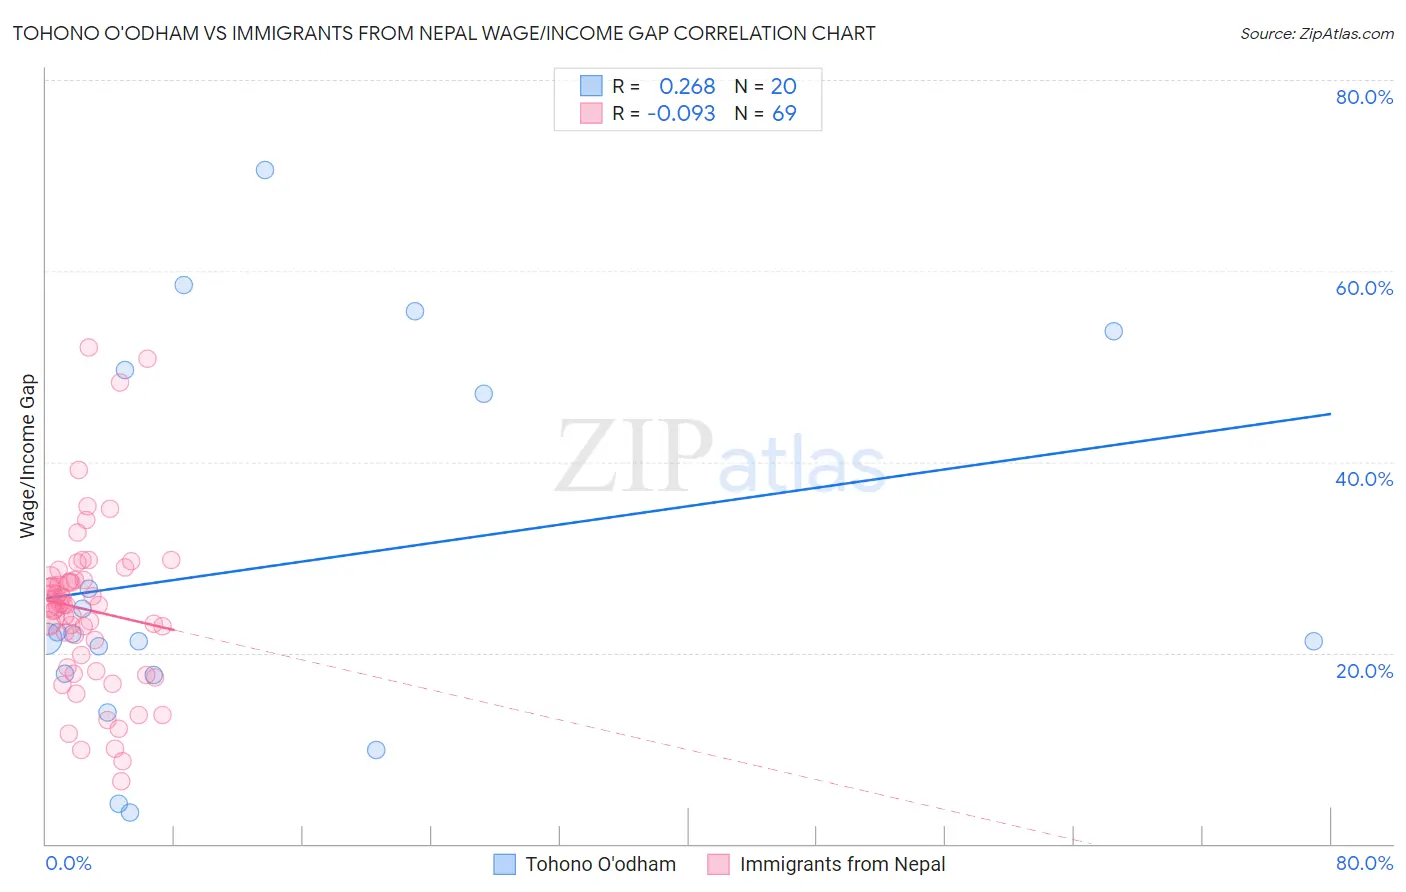
Tohono O'odham vs Immigrants from Nepal Wage/Income Gap Correlation Chart
The statistical analysis conducted on geographies consisting of 58,710,489 people shows a weak positive correlation between the proportion of Tohono O'odham and wage/income gap percentage in the United States with a correlation coefficient (R) of 0.268 and weighted average of 22.1%. Similarly, the statistical analysis conducted on geographies consisting of 186,773,230 people shows a slight negative correlation between the proportion of Immigrants from Nepal and wage/income gap percentage in the United States with a correlation coefficient (R) of -0.093 and weighted average of 24.9%, a difference of 12.3%.
Wage/Income Gap Correlation Summary
| Measurement | Tohono O'odham | Immigrants from Nepal |
| Minimum | 3.3% | 6.5% |
| Maximum | 70.6% | 52.0% |
| Range | 67.3% | 45.5% |
| Mean | 29.1% | 24.5% |
| Median | 21.8% | 25.0% |
| Interquartile 25% (IQ1) | 17.8% | 19.1% |
| Interquartile 75% (IQ3) | 48.4% | 27.6% |
| Interquartile Range (IQR) | 30.7% | 8.5% |
| Standard Deviation (Sample) | 19.4% | 8.6% |
| Standard Deviation (Population) | 19.0% | 8.6% |
Similar Demographics by Wage/Income Gap
Demographics Similar to Tohono O'odham by Wage/Income Gap
In terms of wage/income gap, the demographic groups most similar to Tohono O'odham are Immigrants from Cameroon (22.2%, a difference of 0.080%), Bangladeshi (22.2%, a difference of 0.10%), Nepalese (22.2%, a difference of 0.32%), Immigrants from Western Africa (22.0%, a difference of 0.44%), and Immigrants from Zaire (22.3%, a difference of 0.72%).
| Demographics | Rating | Rank | Wage/Income Gap |
| Immigrants | Eritrea | 100.0 /100 | #44 | Exceptional 21.4% |
| U.S. Virgin Islanders | 100.0 /100 | #45 | Exceptional 21.5% |
| Immigrants | Ethiopia | 100.0 /100 | #46 | Exceptional 21.6% |
| Immigrants | Congo | 100.0 /100 | #47 | Exceptional 21.7% |
| Blacks/African Americans | 100.0 /100 | #48 | Exceptional 21.7% |
| Ethiopians | 100.0 /100 | #49 | Exceptional 21.8% |
| Immigrants | Western Africa | 100.0 /100 | #50 | Exceptional 22.0% |
| Tohono O'odham | 100.0 /100 | #51 | Exceptional 22.1% |
| Immigrants | Cameroon | 100.0 /100 | #52 | Exceptional 22.2% |
| Bangladeshis | 100.0 /100 | #53 | Exceptional 22.2% |
| Nepalese | 100.0 /100 | #54 | Exceptional 22.2% |
| Immigrants | Zaire | 100.0 /100 | #55 | Exceptional 22.3% |
| Immigrants | Ghana | 100.0 /100 | #56 | Exceptional 22.3% |
| Ghanaians | 100.0 /100 | #57 | Exceptional 22.3% |
| Immigrants | Cuba | 100.0 /100 | #58 | Exceptional 22.4% |
Demographics Similar to Immigrants from Nepal by Wage/Income Gap
In terms of wage/income gap, the demographic groups most similar to Immigrants from Nepal are Hawaiian (24.9%, a difference of 0.010%), Hispanic or Latino (24.9%, a difference of 0.030%), Immigrants from Bosnia and Herzegovina (24.8%, a difference of 0.14%), Afghan (24.9%, a difference of 0.21%), and Immigrants from Uganda (24.9%, a difference of 0.22%).
| Demographics | Rating | Rank | Wage/Income Gap |
| Colombians | 92.4 /100 | #133 | Exceptional 24.7% |
| Mexican American Indians | 92.2 /100 | #134 | Exceptional 24.7% |
| South American Indians | 92.0 /100 | #135 | Exceptional 24.7% |
| Armenians | 91.3 /100 | #136 | Exceptional 24.8% |
| Immigrants | South Eastern Asia | 90.9 /100 | #137 | Exceptional 24.8% |
| Immigrants | Bosnia and Herzegovina | 90.1 /100 | #138 | Exceptional 24.8% |
| Hispanics or Latinos | 89.5 /100 | #139 | Excellent 24.9% |
| Immigrants | Nepal | 89.3 /100 | #140 | Excellent 24.9% |
| Hawaiians | 89.3 /100 | #141 | Excellent 24.9% |
| Afghans | 88.1 /100 | #142 | Excellent 24.9% |
| Immigrants | Uganda | 88.0 /100 | #143 | Excellent 24.9% |
| Chippewa | 86.9 /100 | #144 | Excellent 25.0% |
| Comanche | 85.2 /100 | #145 | Excellent 25.0% |
| South Americans | 85.2 /100 | #146 | Excellent 25.0% |
| Malaysians | 84.9 /100 | #147 | Excellent 25.0% |