Tlingit-Haida vs Immigrants from Syria Wage/Income Gap
COMPARE
Tlingit-Haida
Immigrants from Syria
Wage/Income Gap
Wage/Income Gap Comparison
Tlingit-Haida
Immigrants from Syria
24.0%
WAGE/INCOME GAP
98.7/ 100
METRIC RATING
104th/ 347
METRIC RANK
26.4%
WAGE/INCOME GAP
19.3/ 100
METRIC RATING
201st/ 347
METRIC RANK
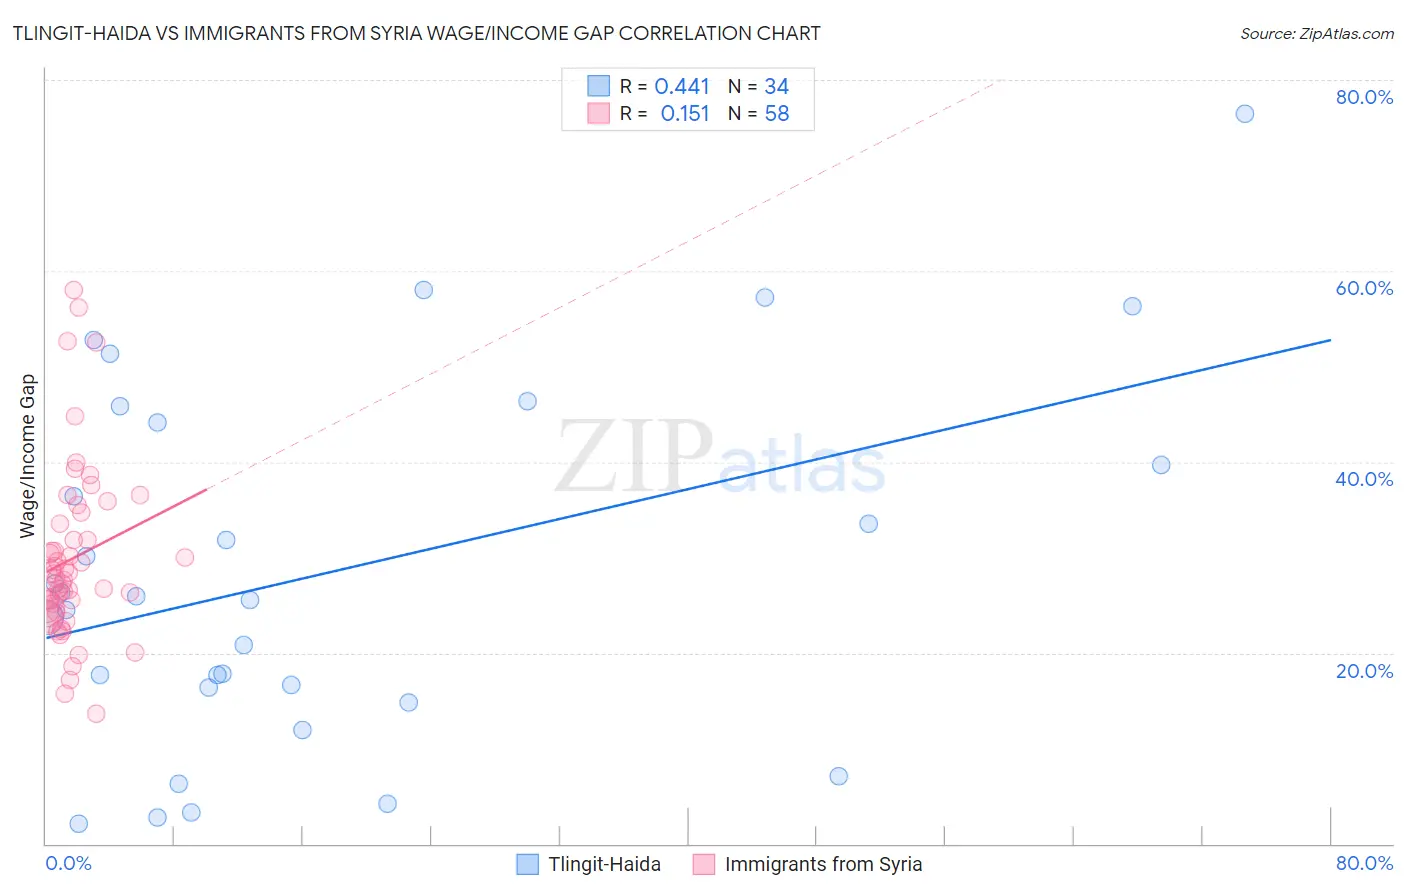
Tlingit-Haida vs Immigrants from Syria Wage/Income Gap Correlation Chart
The statistical analysis conducted on geographies consisting of 60,845,560 people shows a moderate positive correlation between the proportion of Tlingit-Haida and wage/income gap percentage in the United States with a correlation coefficient (R) of 0.441 and weighted average of 24.0%. Similarly, the statistical analysis conducted on geographies consisting of 174,099,463 people shows a poor positive correlation between the proportion of Immigrants from Syria and wage/income gap percentage in the United States with a correlation coefficient (R) of 0.151 and weighted average of 26.4%, a difference of 10.1%.
Wage/Income Gap Correlation Summary
| Measurement | Tlingit-Haida | Immigrants from Syria |
| Minimum | 2.1% | 13.6% |
| Maximum | 76.5% | 58.0% |
| Range | 74.4% | 44.4% |
| Mean | 28.6% | 29.9% |
| Median | 25.7% | 28.0% |
| Interquartile 25% (IQ1) | 16.3% | 24.7% |
| Interquartile 75% (IQ3) | 44.2% | 33.5% |
| Interquartile Range (IQR) | 27.9% | 8.8% |
| Standard Deviation (Sample) | 18.9% | 9.2% |
| Standard Deviation (Population) | 18.6% | 9.1% |
Similar Demographics by Wage/Income Gap
Demographics Similar to Tlingit-Haida by Wage/Income Gap
In terms of wage/income gap, the demographic groups most similar to Tlingit-Haida are Moroccan (24.0%, a difference of 0.060%), Sudanese (24.0%, a difference of 0.060%), Tsimshian (23.9%, a difference of 0.33%), Yaqui (24.0%, a difference of 0.36%), and Immigrants from Albania (24.0%, a difference of 0.37%).
| Demographics | Rating | Rank | Wage/Income Gap |
| Immigrants | Sudan | 99.4 /100 | #97 | Exceptional 23.6% |
| Immigrants | Latin America | 99.2 /100 | #98 | Exceptional 23.7% |
| Aleuts | 99.2 /100 | #99 | Exceptional 23.7% |
| Yakama | 99.2 /100 | #100 | Exceptional 23.7% |
| Japanese | 99.1 /100 | #101 | Exceptional 23.8% |
| Immigrants | Laos | 99.0 /100 | #102 | Exceptional 23.8% |
| Tsimshian | 98.9 /100 | #103 | Exceptional 23.9% |
| Tlingit-Haida | 98.7 /100 | #104 | Exceptional 24.0% |
| Moroccans | 98.6 /100 | #105 | Exceptional 24.0% |
| Sudanese | 98.6 /100 | #106 | Exceptional 24.0% |
| Yaqui | 98.4 /100 | #107 | Exceptional 24.0% |
| Immigrants | Albania | 98.4 /100 | #108 | Exceptional 24.0% |
| Ugandans | 98.3 /100 | #109 | Exceptional 24.1% |
| Immigrants | Morocco | 98.1 /100 | #110 | Exceptional 24.1% |
| Soviet Union | 97.6 /100 | #111 | Exceptional 24.2% |
Demographics Similar to Immigrants from Syria by Wage/Income Gap
In terms of wage/income gap, the demographic groups most similar to Immigrants from Syria are Laotian (26.4%, a difference of 0.010%), Immigrants from Eastern Europe (26.4%, a difference of 0.010%), Immigrants from Russia (26.4%, a difference of 0.030%), Delaware (26.3%, a difference of 0.16%), and Dutch West Indian (26.3%, a difference of 0.17%).
| Demographics | Rating | Rank | Wage/Income Gap |
| Chileans | 22.3 /100 | #194 | Fair 26.3% |
| Immigrants | Malaysia | 22.2 /100 | #195 | Fair 26.3% |
| Immigrants | Western Asia | 21.7 /100 | #196 | Fair 26.3% |
| Zimbabweans | 21.6 /100 | #197 | Fair 26.3% |
| Venezuelans | 21.5 /100 | #198 | Fair 26.3% |
| Dutch West Indians | 21.0 /100 | #199 | Fair 26.3% |
| Delaware | 20.9 /100 | #200 | Fair 26.3% |
| Immigrants | Syria | 19.3 /100 | #201 | Poor 26.4% |
| Laotians | 19.2 /100 | #202 | Poor 26.4% |
| Immigrants | Eastern Europe | 19.2 /100 | #203 | Poor 26.4% |
| Immigrants | Russia | 19.0 /100 | #204 | Poor 26.4% |
| Immigrants | Southern Europe | 17.3 /100 | #205 | Poor 26.4% |
| Indians (Asian) | 16.5 /100 | #206 | Poor 26.4% |
| Immigrants | Italy | 15.8 /100 | #207 | Poor 26.5% |
| Egyptians | 12.7 /100 | #208 | Poor 26.6% |