Barbadian vs Immigrants from Afghanistan Median Male Earnings
COMPARE
Barbadian
Immigrants from Afghanistan
Median Male Earnings
Median Male Earnings Comparison
Barbadians
Immigrants from Afghanistan
$51,236
MEDIAN MALE EARNINGS
3.9/ 100
METRIC RATING
231st/ 347
METRIC RANK
$57,582
MEDIAN MALE EARNINGS
95.4/ 100
METRIC RATING
112th/ 347
METRIC RANK
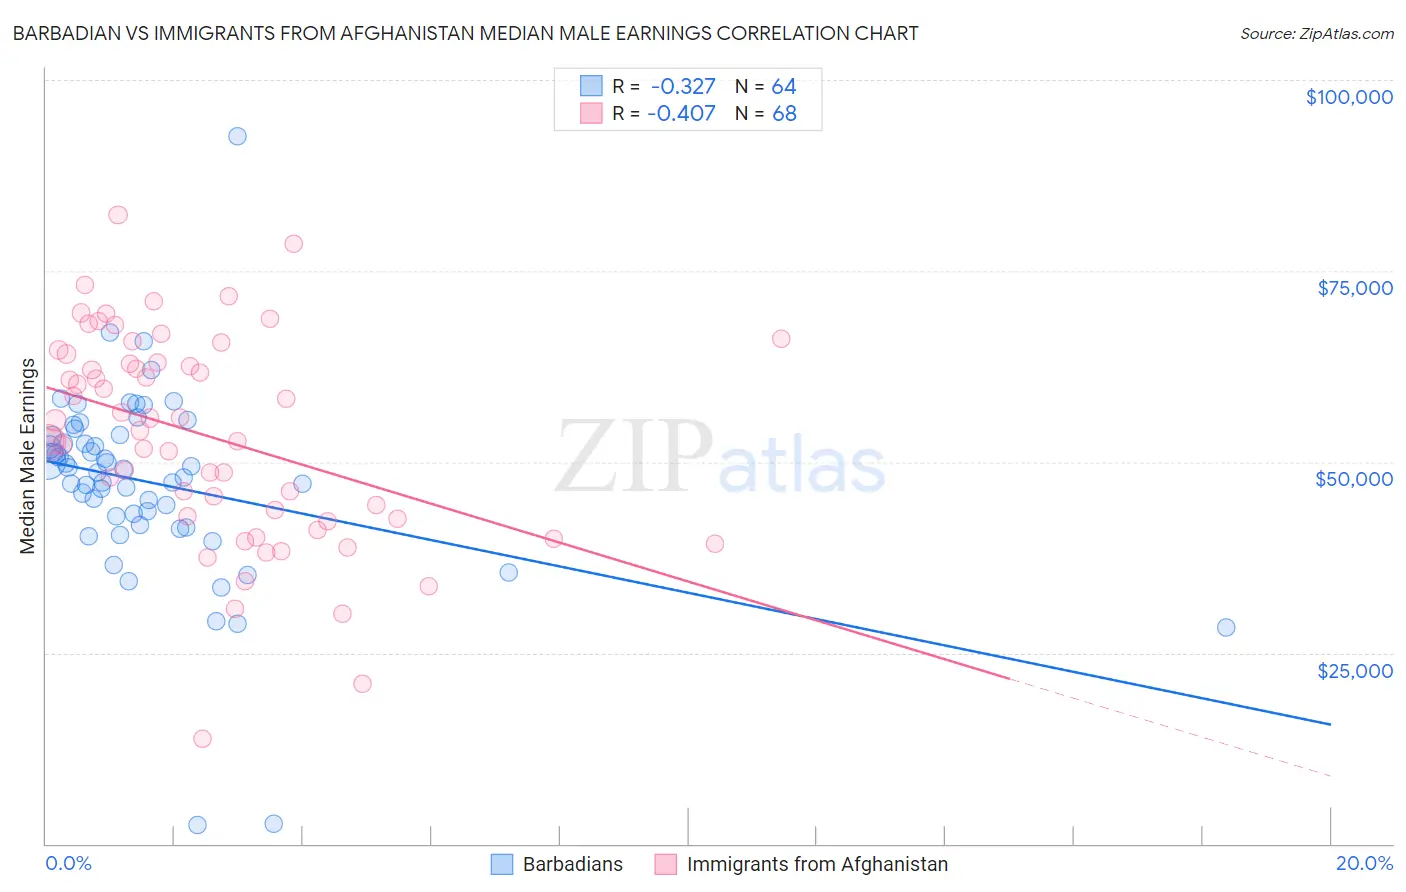
Barbadian vs Immigrants from Afghanistan Median Male Earnings Correlation Chart
The statistical analysis conducted on geographies consisting of 141,271,676 people shows a mild negative correlation between the proportion of Barbadians and median male earnings in the United States with a correlation coefficient (R) of -0.327 and weighted average of $51,236. Similarly, the statistical analysis conducted on geographies consisting of 147,642,339 people shows a moderate negative correlation between the proportion of Immigrants from Afghanistan and median male earnings in the United States with a correlation coefficient (R) of -0.407 and weighted average of $57,582, a difference of 12.4%.
Median Male Earnings Correlation Summary
| Measurement | Barbadian | Immigrants from Afghanistan |
| Minimum | $2,499 | $13,824 |
| Maximum | $92,582 | $82,319 |
| Range | $90,083 | $68,496 |
| Mean | $47,251 | $53,392 |
| Median | $48,821 | $54,756 |
| Interquartile 25% (IQ1) | $42,256 | $42,712 |
| Interquartile 75% (IQ3) | $53,422 | $63,573 |
| Interquartile Range (IQR) | $11,166 | $20,861 |
| Standard Deviation (Sample) | $12,825 | $13,746 |
| Standard Deviation (Population) | $12,724 | $13,644 |
Similar Demographics by Median Male Earnings
Demographics Similar to Barbadians by Median Male Earnings
In terms of median male earnings, the demographic groups most similar to Barbadians are Sudanese ($51,216, a difference of 0.040%), Aleut ($51,168, a difference of 0.13%), Immigrants from Nigeria ($51,310, a difference of 0.14%), Cape Verdean ($51,103, a difference of 0.26%), and Immigrants from Trinidad and Tobago ($51,376, a difference of 0.27%).
| Demographics | Rating | Rank | Median Male Earnings |
| Immigrants | Cambodia | 5.5 /100 | #224 | Tragic $51,594 |
| Immigrants | Sudan | 5.0 /100 | #225 | Tragic $51,489 |
| Japanese | 4.9 /100 | #226 | Tragic $51,473 |
| Trinidadians and Tobagonians | 4.8 /100 | #227 | Tragic $51,446 |
| Samoans | 4.6 /100 | #228 | Tragic $51,389 |
| Immigrants | Trinidad and Tobago | 4.5 /100 | #229 | Tragic $51,376 |
| Immigrants | Nigeria | 4.2 /100 | #230 | Tragic $51,310 |
| Barbadians | 3.9 /100 | #231 | Tragic $51,236 |
| Sudanese | 3.9 /100 | #232 | Tragic $51,216 |
| Aleuts | 3.7 /100 | #233 | Tragic $51,168 |
| Cape Verdeans | 3.5 /100 | #234 | Tragic $51,103 |
| Immigrants | Western Africa | 3.0 /100 | #235 | Tragic $50,940 |
| Pennsylvania Germans | 2.8 /100 | #236 | Tragic $50,878 |
| Immigrants | Barbados | 2.6 /100 | #237 | Tragic $50,795 |
| Malaysians | 2.5 /100 | #238 | Tragic $50,772 |
Demographics Similar to Immigrants from Afghanistan by Median Male Earnings
In terms of median male earnings, the demographic groups most similar to Immigrants from Afghanistan are Carpatho Rusyn ($57,572, a difference of 0.020%), Immigrants from Kuwait ($57,562, a difference of 0.040%), European ($57,637, a difference of 0.090%), Swedish ($57,445, a difference of 0.24%), and Lebanese ($57,409, a difference of 0.30%).
| Demographics | Rating | Rank | Median Male Earnings |
| Immigrants | Western Asia | 97.3 /100 | #105 | Exceptional $58,131 |
| Immigrants | Northern Africa | 96.9 /100 | #106 | Exceptional $58,008 |
| Serbians | 96.8 /100 | #107 | Exceptional $57,975 |
| Immigrants | Uzbekistan | 96.7 /100 | #108 | Exceptional $57,941 |
| British | 96.5 /100 | #109 | Exceptional $57,890 |
| Palestinians | 96.2 /100 | #110 | Exceptional $57,778 |
| Europeans | 95.6 /100 | #111 | Exceptional $57,637 |
| Immigrants | Afghanistan | 95.4 /100 | #112 | Exceptional $57,582 |
| Carpatho Rusyns | 95.3 /100 | #113 | Exceptional $57,572 |
| Immigrants | Kuwait | 95.3 /100 | #114 | Exceptional $57,562 |
| Swedes | 94.8 /100 | #115 | Exceptional $57,445 |
| Lebanese | 94.6 /100 | #116 | Exceptional $57,409 |
| Immigrants | Zimbabwe | 94.3 /100 | #117 | Exceptional $57,352 |
| Hungarians | 94.0 /100 | #118 | Exceptional $57,309 |
| Arabs | 94.0 /100 | #119 | Exceptional $57,298 |